Figure 2.
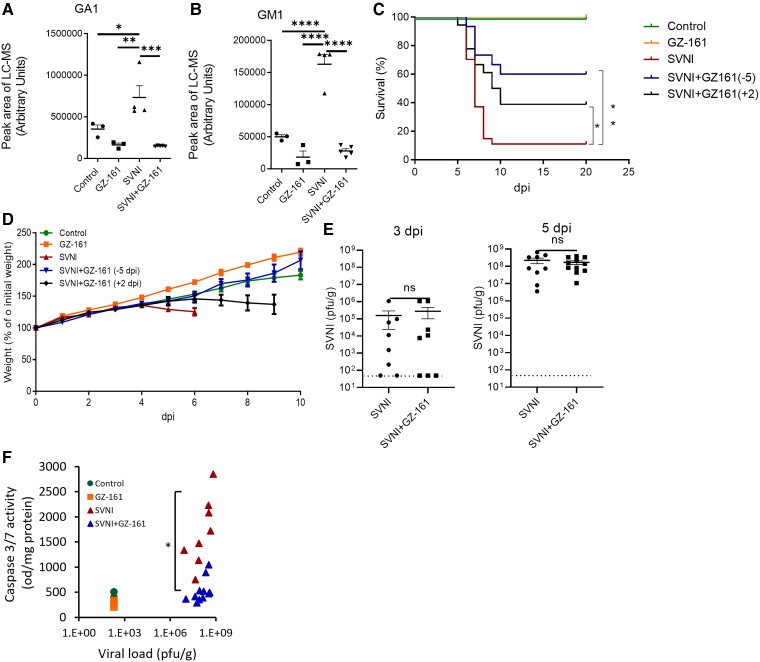
GZ-161 extends the survival of SVNI-infected mice. (A, B) SVNI infection induces elevation in the GA1 (A) and GM1 (B) levels in murine serum. The mice were either infected with SVNI (15 PFUs, administered i.p.) or not infected (control, n = 3; 2 females, 1 male) and were either left untreated (SVNI, n = 3; 2 females, 1 male) or treated with GZ-161 (20 mg/kg/day, i.p., beginning on day 5 preinfection; GZ-161, n = 4, 2 females, 2 males; SVNI + GZ-161, n = 5, 2 females, 3 males). The ganglioside levels in serum samples obtained at day 5 postinfection were analyzed by LC–MS. The LC–MS peak area was divided by milligrams of protein in the sample for calibration. GA1, asialo GM1. The statistical analysis was performed by one-way ANOVA followed by a Tukey’s multiple comparison test. The P values are indicated by asterisks as follows: *P < 0.05, **P < 0.01, ***P < 0.001 and ****P < 0.0001. Differences with a P value of 0.05 or less were considered significant. Graphs were generated using GraphPad Prism software version 8.4.3. (C) Kaplan–Meier survival curves of SVNI-infected mice (15 PFUs, administered i.p.). Mice were either left untreated (SVNI, n = 27; 15 females, 12 males) or treated with GZ-161 (20 mg/kg/day, i.p., beginning on day 5 preinfection [SVNI + GZ-161 (−5), n = 15; 8 females, 7 males] or day 2 postinfection [SVNI + GZ-161 (+2), n = 18; 10 females, 8 males]. The control mice were left uninfected (n = 6; 3 females, 3 males). Comparisons of the Kaplan–Meier survival curves by the log-rank test indicated a significant decrease in the mortality of GZ-161-treated mice compared with the SVNI mice. *P < 0.05; **P < 0.01. (D) Body weight (% of infection day 0) of C57BL/6 mice untreated (control, n = 5; 2 females, 3 males) or treated with GZ-161 (20 mg/kg per day, n = 8; 4 females, 4 males) beginning on day 5 preinfection [SVNI + GZ-161 (−5), n = 15; 8 females, 7 males] or day 2 postinfection [SVNI + GZ-161 (+2), n = 6; 3 females, 3 males]. The mice were left uninfected or infected with a lethal dose (15 PFUs) of SVNI (SVNI, n = 15; 7 females, 8 males) at 21 days of age. The results are the means ± SEs. (E) The SVNI viral load in brain homogenates was measured by a PFU assay at 3 and 5 dpi. Similar viral loads in the brains of SVNI and SVNI + GZ-161 mice were detected. GZ-161 (20 mg/kg/day, i.p.) was administered beginning on day 5 preinfection. The results are the means ± SEMs (n = 8 (4 females, 4 males) for each group at 3 dpi, at 5 dpi: n = 9 (4 females, 5 males) for SVNI, n = 11 (6 females, 5 males) for SVNI + GZ-161). The statistical analysis was performed by a two-tailed unpaired t test. ns, not significant. The dotted line reflects the limit of detection (LOD) (F) Activity of caspase-3/7 versus the viral load in brain homogenates at 5 dpi. Each dot represents the value found for the brain (n = 3, control and GZ-161; n = 8, SVNI; and n = 11, SVNI + GZ-161). The statistical analysis was performed using the Kruskal–Wallis test followed by Dunnett’s post hoc test for pairwise comparisons. A significant reduction in caspase-3 activity was detected in SVNI + GZ-161 cells compared with SVNI cells (*P < 0.05).

