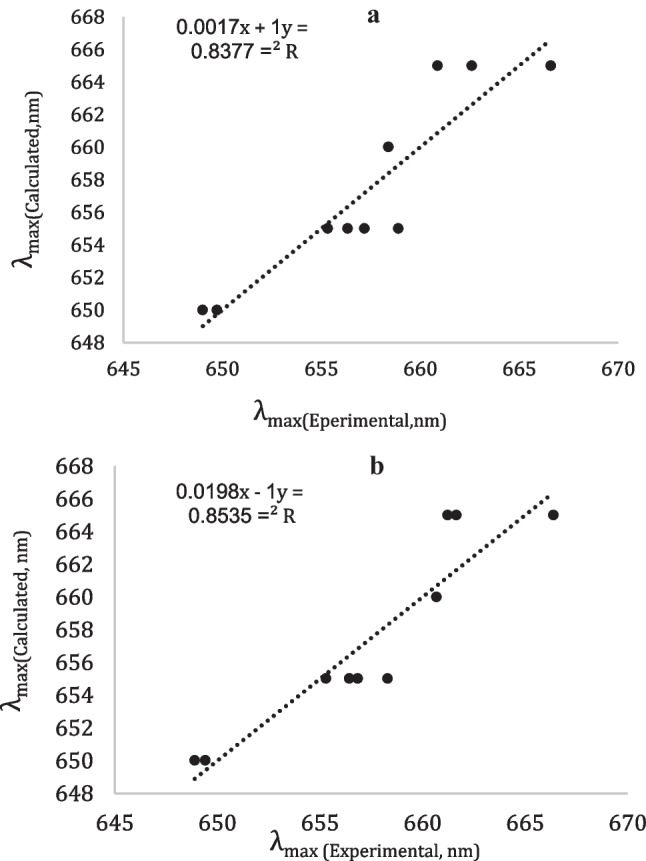
Fig. 3.

Linear correlations between experimental and calculated λmax(MB) values (in nm) using LSERs for methylene blue in various neat solvents by using Eq. (1) with a K, M, N and E parameters and b J, H, N and E parameters

Linear correlations between experimental and calculated λmax(MB) values (in nm) using LSERs for methylene blue in various neat solvents by using Eq. (1) with a K, M, N and E parameters and b J, H, N and E parameters