
Fig. 3.
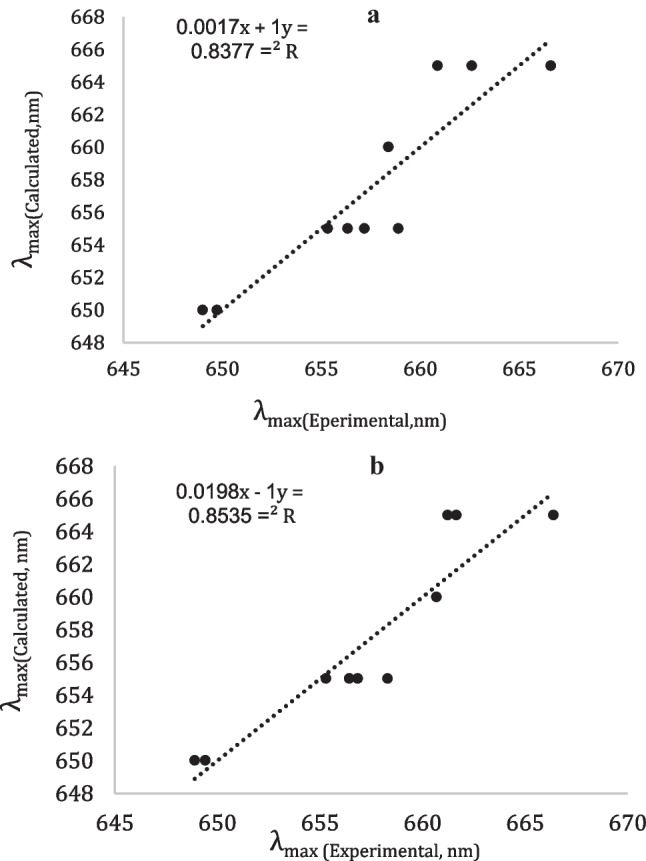
Linear correlations between experimental and calculated λmax(MB) values (in nm) using LSERs for methylene blue in various neat solvents by using Eq. (1) with a K, M, N and E parameters and b J, H, N and E parameters
Official websites use .gov
A
.gov website belongs to an official
government organization in the United States.
Secure .gov websites use HTTPS
A lock (
) or https:// means you've safely
connected to the .gov website. Share sensitive
information only on official, secure websites.
Linear correlations between experimental and calculated λmax(MB) values (in nm) using LSERs for methylene blue in various neat solvents by using Eq. (1) with a K, M, N and E parameters and b J, H, N and E parameters