
Figure 1. Both TFEB and TFE3 contribute to kidney pathology in Flcn KO mice.
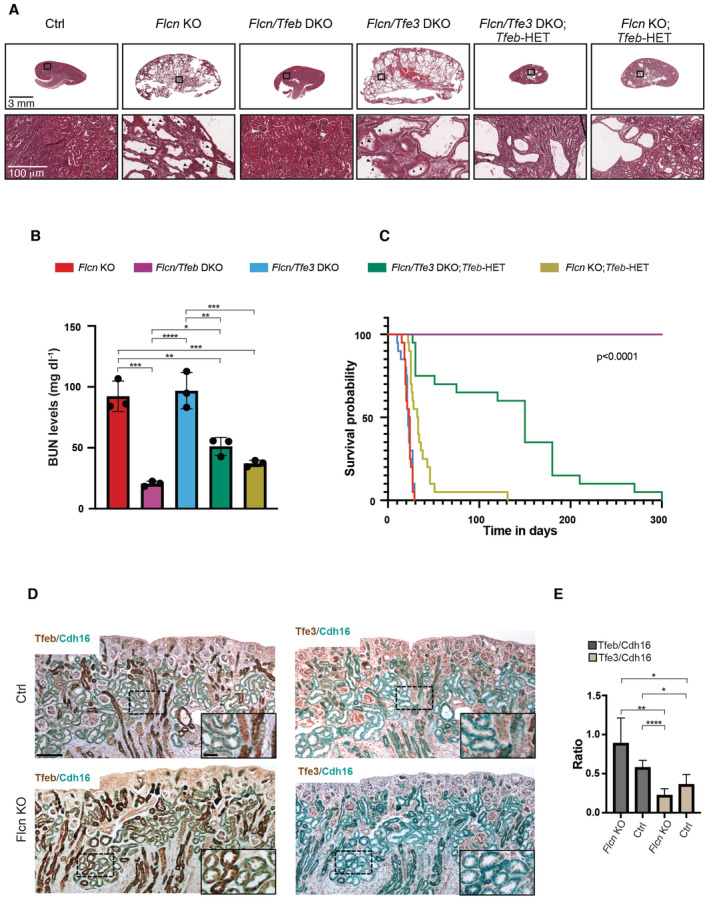
- Hematoxylin and eosin (H&E) staining of kidneys from control (Flcn flox/flox ), Flcn KO, Flcn/Tfeb DKO, Flcn/Tfe3 DKO, Flcn/Tfe3 DKO; Tfeb‐HET and Flcn KO; Tfeb‐HET mice at p18 (replicated three times). Scale bars, 3 mm (upper panels). Boxed areas are magnified in the bottom panels. Arrowhead indicates tubular papillary atypical hyperplasia. Scale bars, 100 μm (lower panels).
- Blood urea nitrogen (BUN) levels in mice of the indicated genotypes at p18 (mean ± SD, n = 3). One‐way ANOVA and the Tukey's HSD posthoc test (corrected for multiple comparisons) were applied. Significance for each comparison is provided in Materials and Methods.
- Kaplan–Meyer survival analysis of the indicated genotypes (n = 20 for each genotype); log‐rank test, P‐value < 0.0001.
- Representative immunohistochemical (IHC) analysis of Tfeb or Tfe3 and Cadherin‐16 (Cdh16) on adjacent kidney sections from mice of the indicated genotypes at p2. Tfeb and Tfe3 were stained in DAB, Cdh16 was stained in teal. Nuclei were stained with hematoxylin II (blue). Magnification: 10×, scale bar: 100 μm. Magnification: 20× (in inset image), scale bar: 25 μm.
- Quantification of TFEB or TFE3 levels relative to cadherin 16 (indicated as ratio); values represent mean ± SEM (n = 4 biological replicates for each genotype). A Welch's One Way ANOVA test with the Dunnett's T3 multiple comparisons test was applied. Significance for each comparison is provided in Materials and Methods.
Data information: *P < 0.05; **P < 0.01; ***P < 0.001.
Source data are available online for this figure.