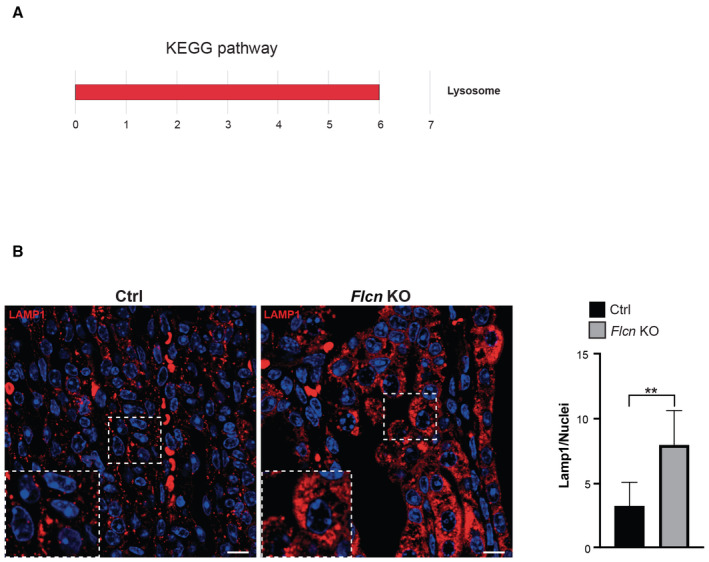
Figure EV1. Kidney tissues from Flcn‐KO mice show upregulation of the lysosomal pathway.

- Kegg pathway associated with genes significantly upregulated in kidney tissues from Flcn KO mice relative to control mice at the precystic stage p2 (Dataset EV1).
- Lamp1 immunostaining (in red) of renal tissues from control (Ctrl) and kidney‐specific Flcn KO (Flcn KO) mice. Insets show magnification of the boxed area. Nuclei were stained with DAPI (blue). Scale bar 10 μm. Bar graph shows quantification of Lamp1‐positive vesicles/nuclei. Mean ± 95% of confidence interval (n = 3 biological replicates). Unpaired t‐test **P < 0.01.
Source data are available online for this figure.
