
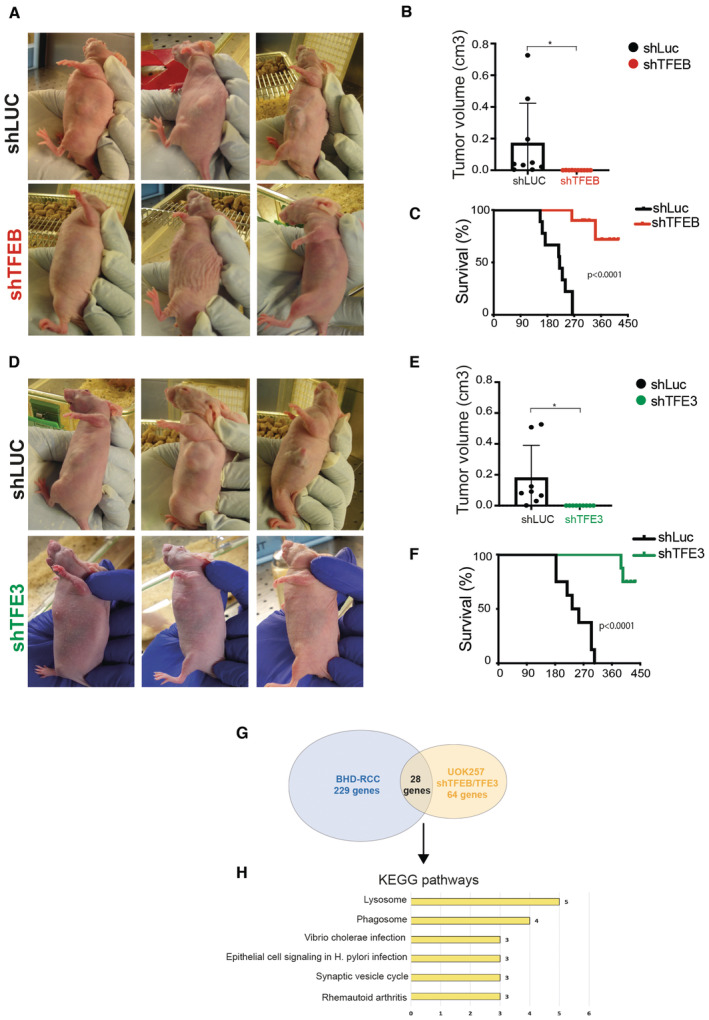
Figure 3. Silencing of TFEB or TFE3 inhibits the growth of BHD‐associated tumors.
-
A–F(A, D) Representative pictures of mice injected with UOK257 cells silenced for luciferase (shLuc) (A, D) or for TFEB (A) or for TFE3 (D). Pictures were taken approximately 4 months after injection. (B, E) Plots show tumor volumes in mice injected with UOK257/shLuc (n = 8) or UOK257/shTFEB (n = 10) (B) and mice injected with UOK257/shLuc (n = 8) or UOK257/shTFE3 (n = 9) (E); (mean ± SD). *P = 0.036 for plot in (B) and *P = 0.023 for plot in (E); unpaired t‐test. (C, F) Kaplan–Meier analysis of mice survival relative to the two experimental groups. Long‐rank test, P < 0.0001. The median survival time of mice injected with UOK257/shLuc is 219.5 days in (C) and 244.5 days in (F).
-
GVenn diagram showing overlapping genes in the analyzed data sets.
-
HKEGG pathways relative to overlapping genes in (G) (Dataset EV4).
Source data are available online for this figure.