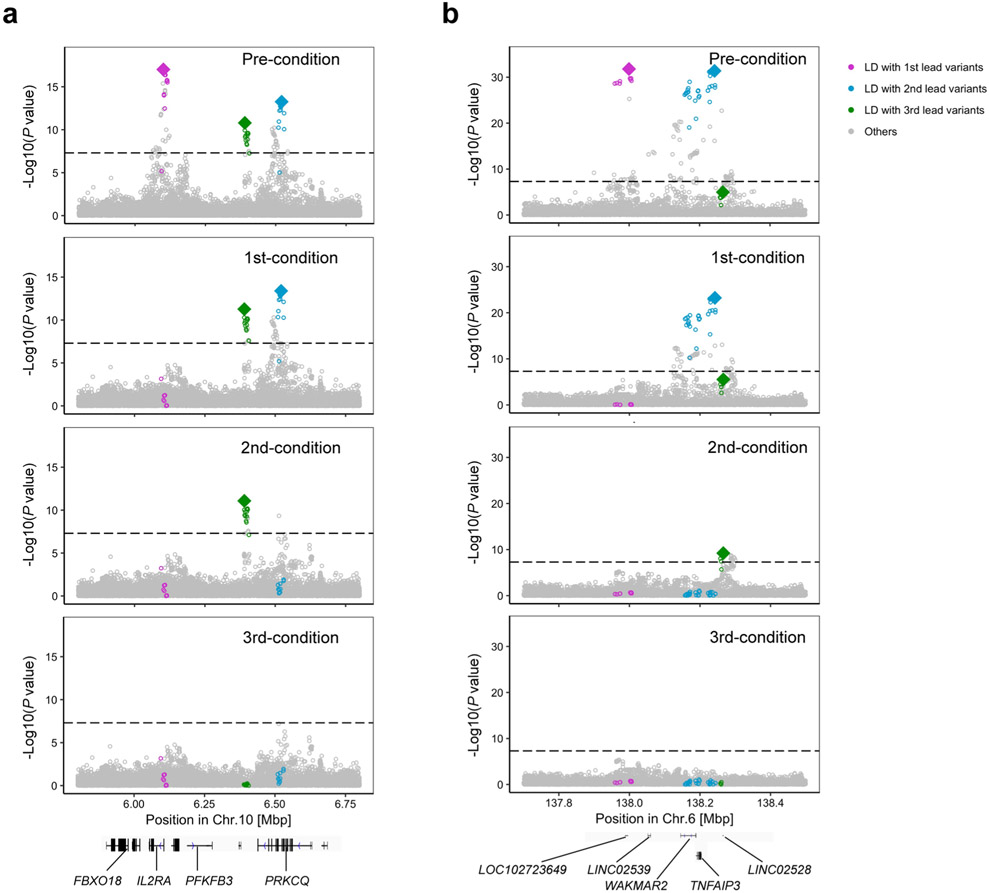
Extended Data Fig. 4 ∣. Conditional analysis results at the IL2RA and TNFAIP3 loci.
a,b, Conditional analysis was conducted in each cohort, and the results were meta-analyzed using the inverse-variance weighted fixed effect model (a, IL2RA locus; b, TNFAIP3 locus). We used multi-ancestry GWAS results. Results at the TYK2 locus are provided in Extended Data Fig. 6. Variants in LD with the lead variant (r2 > 0.6 both in EUR and EAS ancestries) in each round of conditional analysis are highlighted by different colors.

