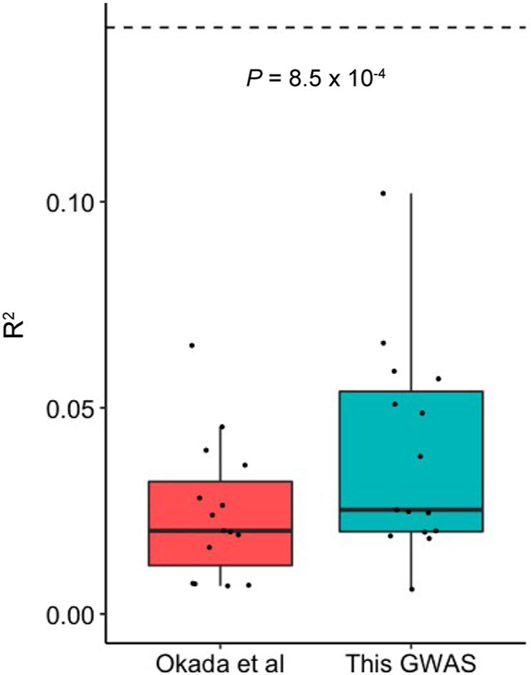
Extended Data Fig. 8 ∣. PRS performance comparison between the previous RA GWAS and this GWAS.
The liability scale R2 in the 15 cohorts not included in the previous RA GWAS. We used the multi-ancestry GWAS results reported in Okada et al. and this GWAS to develop PRS models. We used the LOCO approach to evaluate the PRS model based on this GWAS. The differences were assessed by two-sided paired Wilcoxon text (n = 15). Within each boxplot, the horizontal lines reflect the median, the top and bottom of each box reflect the interquartile range (IQR), and the whiskers reflect the maximum and minimum values within each grouping no further than 1.5 × IQR from the hinge.

