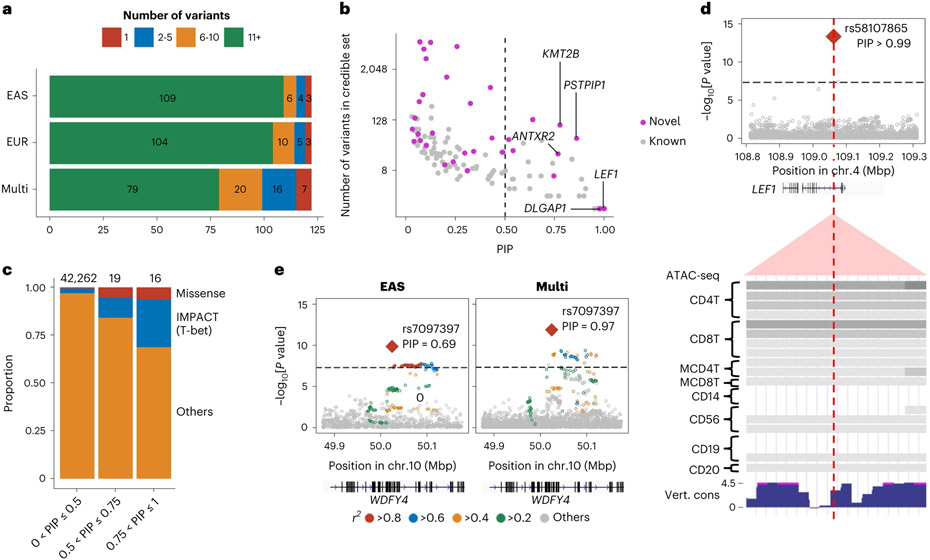
Fig. 2 ∣. Fine-mapping analysis identified candidate causal variants.
a, Among 122 autosomal loci analyzed, we counted the number of loci that had a 95% credible set size in a specified range. The results from EAS-GWAS, EUR-GWAS and multi-ancestry GWAS are provided. b, The PIP of the lead variant and the size of the 95% credible set at the 122 autosomal loci analyzed. The names of novel loci with a PIP greater than 0.75 are labeled. We used multi-ancestry GWAS results. c, In each range of PIP (the total numbers of variants are provided on top), we calculated the proportion of non-synonymous variants or variants with high IMPACT score (CD4+ T cell T-bet annotation > 0.5). d, A fine-mapped variant at the LEF1 locus within CD4+ T cell-specific open chromatin regions. P values of multi-ancestry GWAS are provided with a dense view of immune cell ATAC-seq data (density indicates the read coverage) and vertebrate conservation data from the UCSC Genome Browser (http://genome.ucsc.edu). e, P values in the WDFY4 locus in EAS-GWAS and multi-ancestry GWAS. r2 values between each variant and the lead variant (rs7097397) are shown using different colors. For multi-ancestry GWAS, we used intersection of LD variants in EUR and EAS ancestries. P values in the GWAS results (d and e) were calculated by a fixed effect meta-analysis of statistics from logistic regression tests in each cohort.

