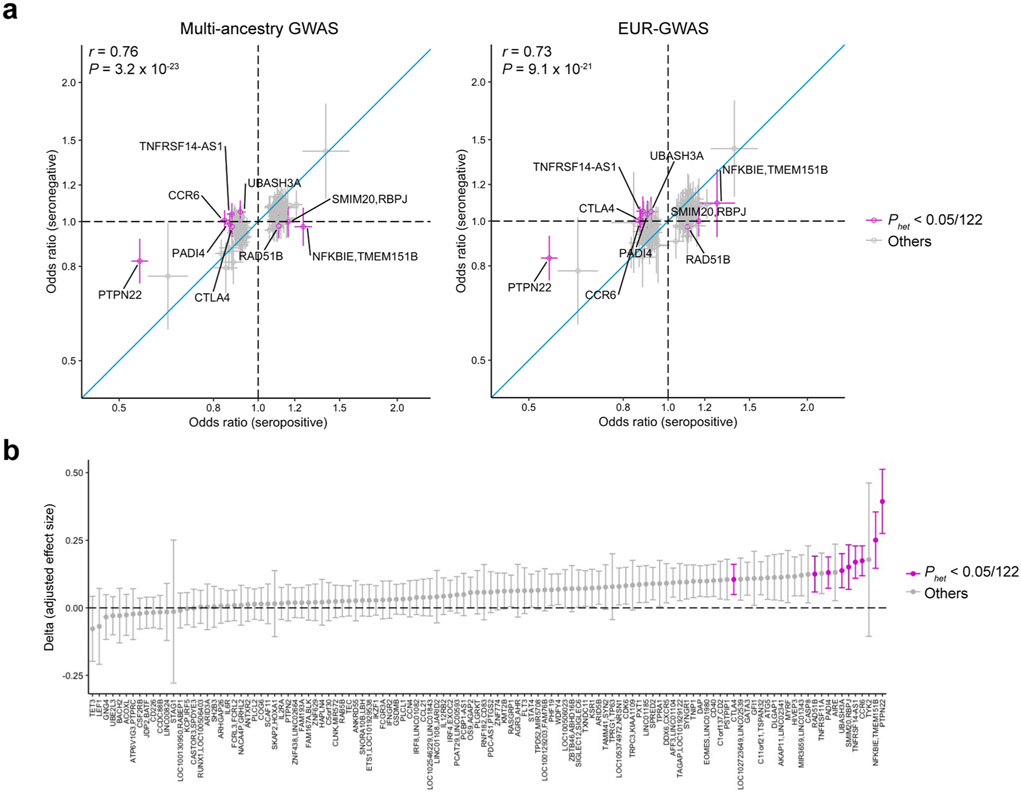
Extended Data Fig. 2 ∣. Effect size heterogeneity between seropositive and seronegative RA.
a, Odds ratio and its 95% confidence interval of seropositive and seronegative RA are plotted. Among the lead variants at 122 significant autosomal loci, we plotted 118 variants common in EUR of 1KG Phase 3 (MAF > 0.01). We present the results from multi-ancestry GWAS and EUR-GWAS. Effect size heterogeneity was assessed in the multi-ancestry GWAS results by Cochran’s Q test (Phet). Pearson’s correlation data are provided. b, Differences (delta) of effect size magnitude between seropositive and seronegative RA. A positive delta indicates a larger magnitude of effect size in seropositive RA than seronegative RA. We defined the standard error (s.e.) of delta by the following formula: . We provided 2 × s.e. of delta as error bars. In seropositive RA GWAS, we had 27,448 cases and 240,149 controls; in seronegative RA GWAS, we had 4,515 cases and 240,149 controls.

