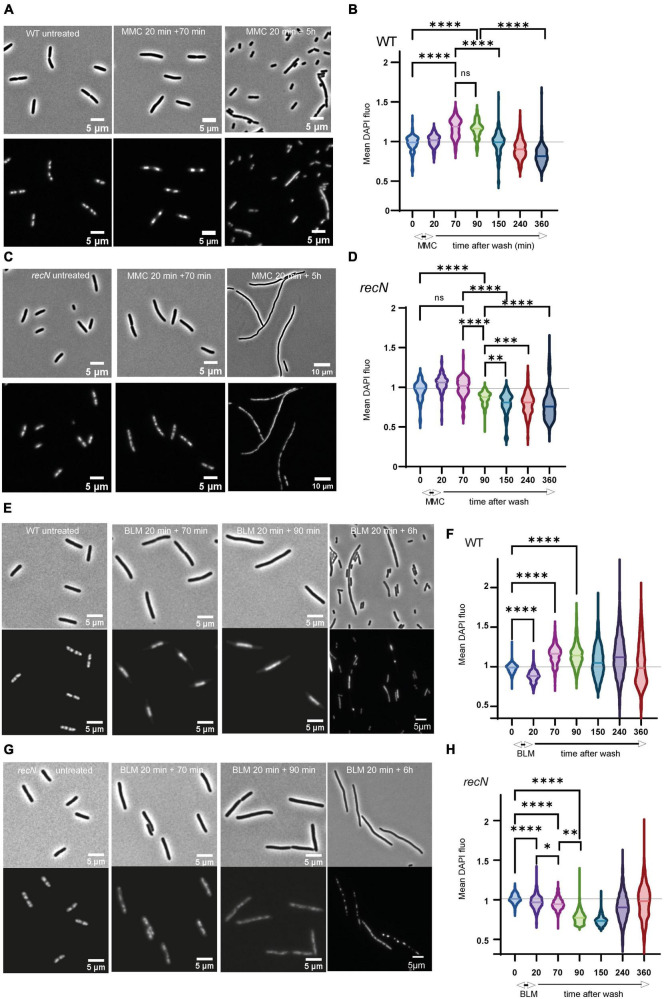
FIGURE 2.
RecN’s influence of nucleoid compaction. (A) Observation of cells and nucleoid of WT cells treated with MMC (B) quantification of the mean DAPI fluorescence in the nucleoid area of WT cells treated with MMC. Integrated fluorescence amount in the nucleoid divided by the area of the nucleoid is a proxy for nucleoid compaction. (C) Same as A for the recN mutant. (D) Same as B for the recN mutant. (E) Observation of cells and nucleoid of WT cells treated with BLM. (F) Quantification of the mean DAPI fluorescence in the nucleoid area of WT cells treated with BLM. (G) Same as D for the recN mutant. (H) Same as F for the recN mutant. N = 500, Anova statistical test *<0.05, **<0.005, ***<0.0005, ****<0.00005.

