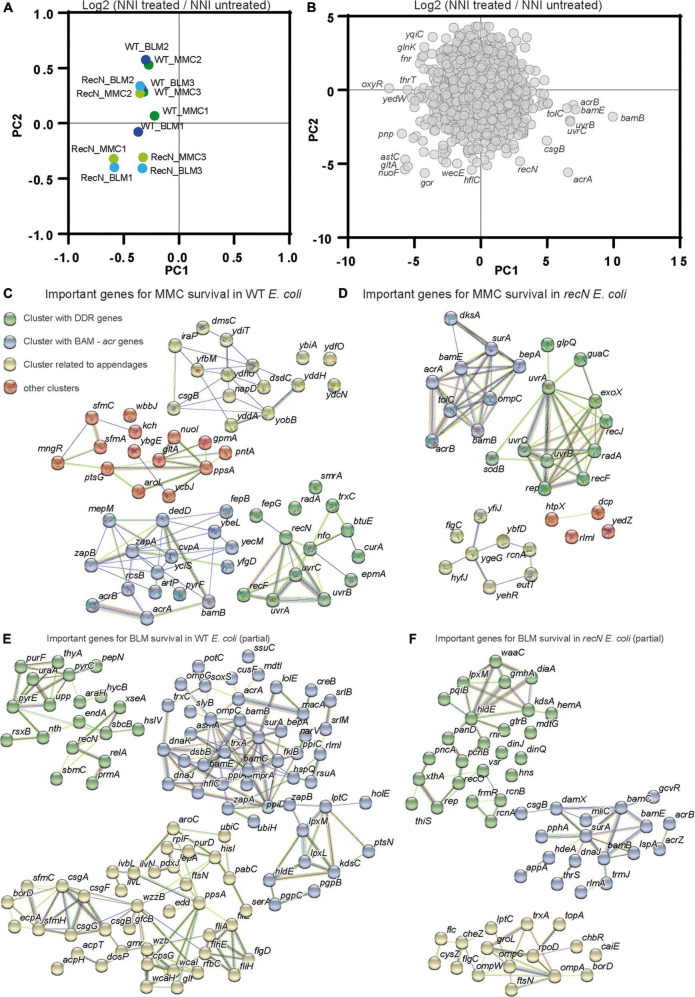
FIGURE 3.
Transposon-insertion sequencing (TIS) analysis of the GSR associated with BLM and MMC tolerance. (A) Principal component analysis of TIS data. Fold changes (Log2 NNI treated/NNI untreated) were used to cluster conditions and replicates. (B) Principal component analysis of TIS data. TIS fold change in the different conditions and replicates was used to cluster genes. (C) Functional Kmeans clustering (https://string-db.org, medium confidence score) of important genes (Log2 FC MMC–wt < –2, P-value <0.1) for MMC survival in WT E. coli. (D) Functional Kmeans clustering of important genes for MMC survival in the recN strain. (E) Functional Kmeans clustering of important genes for BLM survival in WT E. coli. Only a portion of the genes was represented (63/123), the full list is available on Supplementary Table 1. (F) Functional Kmeans clustering of important genes for BLM survival in the recN strain. Only a portion of the genes was represented (52/95).

