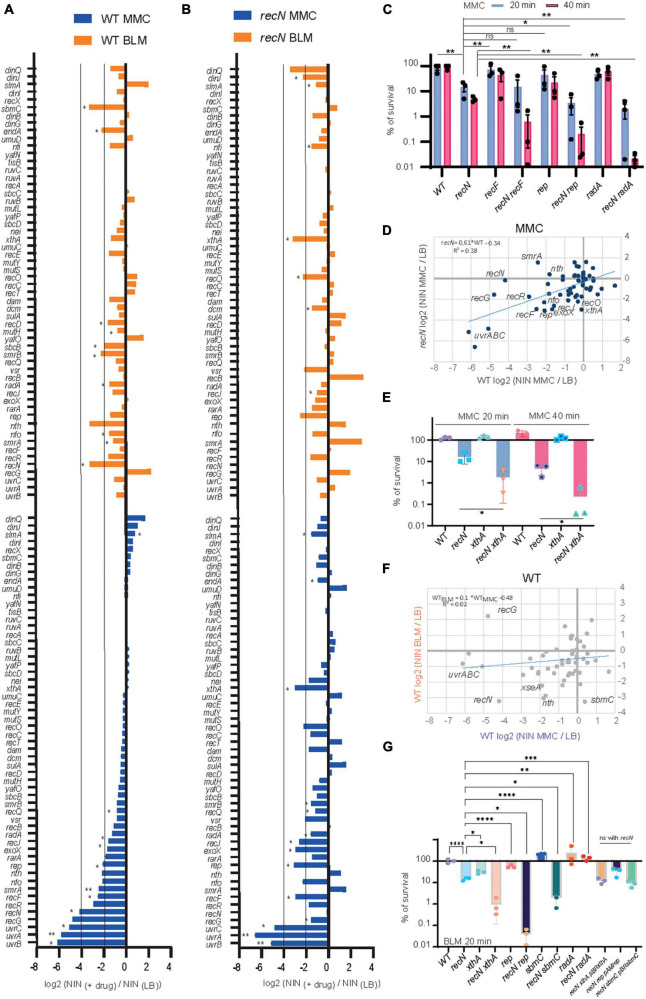
FIGURE 4.
Transposon-insertion sequencing (TIS) analysis of the DDR genes involved in BLM and MMC tolerance. (A) TIS results in the presence of MMC or BLM for the subset of E. coli DDR genes in the WT strain. Results are average of three replicates and analyzed with multiple paired t-test *<0.1; **<0.05 (B) same as A for the recN strain. (C) CFU analysis of the WT, recN, recF, rep, and radA single and double mutants in the presence of MMC. Anova statistical test *<0.05, **<0.005 (D) comparison of the TIS results in MMC for the WT (Log2 FC MMC–WT) and recN strain (Log2 FC MMC–recN). (E) CFU analysis of the WT, recN, xthA, and recN xthA mutants in the presence of MMC. Anova statistical test *<0.05. (F) Comparison of the TIS results in WT strain in MMC (Log2 FC MMC–WT) and BLM (Log2 FC BLM–wt). (G) CFU analysis of the WT, recN, xthA, recN xthA, rep, recN rep, sbmC, recN sbmC, radA, and recN radA mutants in the presence of MMC. To reveal additive effects of the double mutants BLM at 0.5 μg/ml for 20 min was used. Anova statistical test *<0.05, **<0.005, ***<0.0005, ****<0.00005.

