
FIGURE 2.
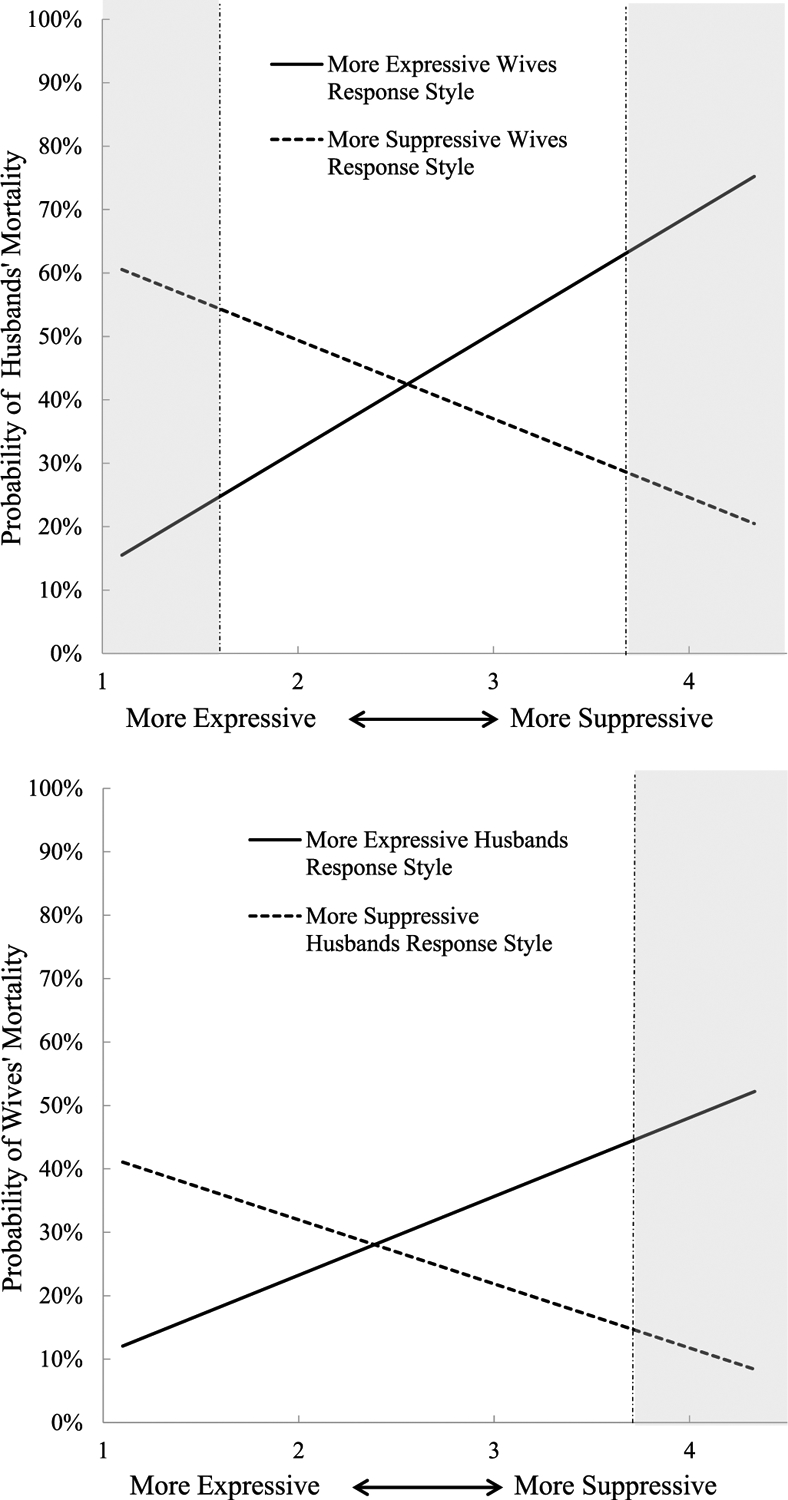
Visualization of the interaction of spouses’ anger-coping response styles predicting the percentage chance of husbands’ and wives’ death 32 years later. The two lines of best fit represent participant scores 1 SD below and 1 SD above the mean on the anger-coping response scale, corresponding to a more suppressive and expressive anger-coping response style. The shaded areas represent areas of significance, where the two lines of fit vary significantly at a p < .05 level.