Figure 1.
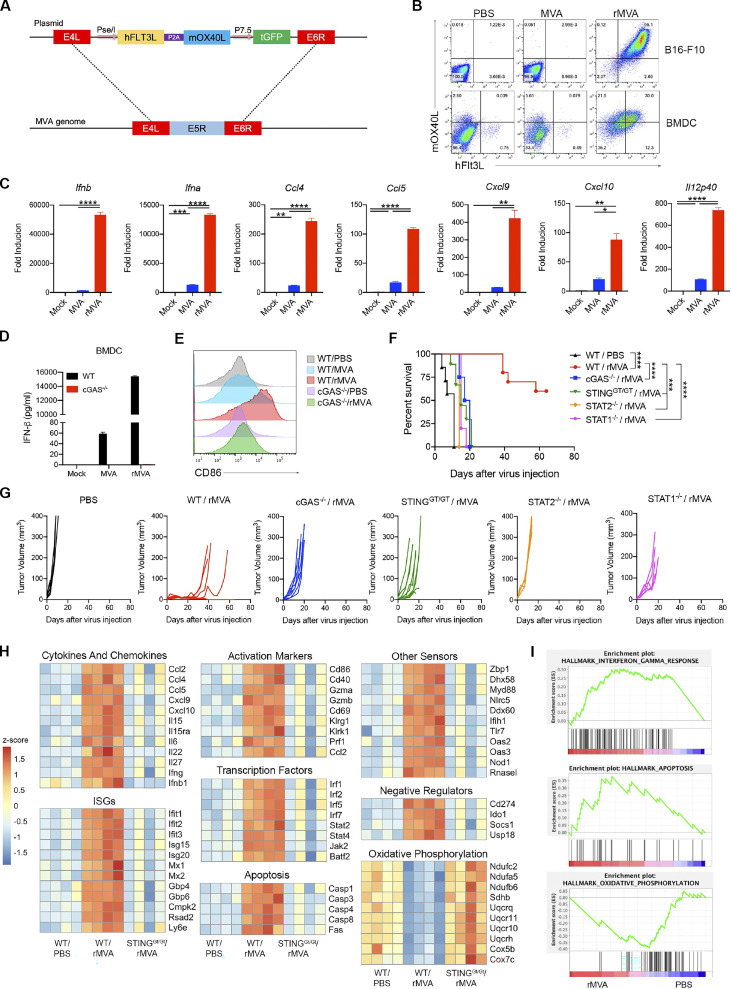
IT injection of rMVA elicits strong antitumor immunity. (A) Schematic diagram for the generation of rMVA through homologous recombination. (B) Representative flow cytometry plots of expression of hFlt3L or mOX40L in rMVA-infected B16-F10 cells and BMDCs. (C) Relative mRNA expression levels of Ifnb, Ifna, Ccl4, Ccl5, Cxcl9, Cxcl10, and Il12p40 in BMDCs infected with MVA or rMVA. Data are means ± SD (n = 3; *P < 0.05, **P < 0.01, ***P < 0.001, ****P < 0.0001, t test). A representative experiment is shown, repeated twice. (D) Concentrations of secreted IFN-β in the medium of WT or cGas−/− BMDCs infected with MVA or rMVA. Data are means ± SD. (E) Mean fluorescence intensity of CD86 expressed by WT or cGas−/− BMDCs infected with MVA or rMVA. (F) Kaplan–Meier survival curve of mice treated with rMVA or PBS in a unilateral B16-F10 implantation model (n = 5 ∼ 10; ***P < 0.001, ****P < 0.0001, Mantel-Cox test). A representative experiment is shown, repeated once. (G) Tumor growth curve of mice treated with rMVA or PBS in a unilateral B16-F10 implantation model. (H) Heatmap of gene expression from RNA-seq analysis of RNAs isolated from tumors implanted on WT or Stinggt/gt mice treated with or without IT delivery of rMVA. (I) Gene set enrichment analysis of the expression of genes involved IFN-γ response, apoptosis, and oxidative phosphorylation in tumors treated with rMVA vs. PBS control.

