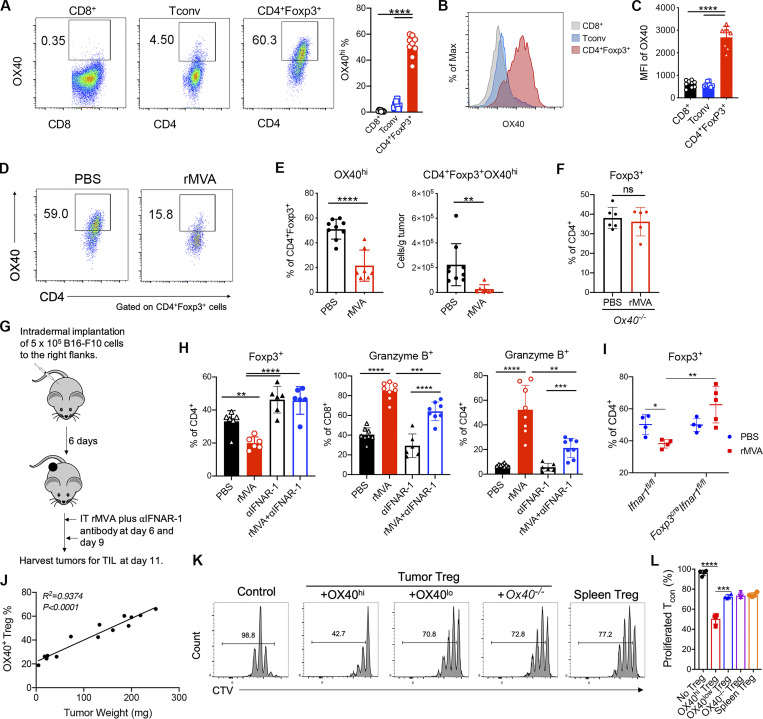
Figure 5.
IT rMVA preferentially depletes OX40hi Tregs in the injected tumors in a type I IFN signaling dependent manner. (A) Representative flow cytometry plots of OX40 expression on tumor infiltrating CD8+, Tconv (CD4+Foxp3−), and CD4+Foxp3+ T cells in tumors 15 d after implantation. Mice were treated as described in Fig. 2 A. (B and C) Representative flow cytometry plots and statistical analysis of mean fluorescence intensity (MFI) of OX40 on tumor-infiltrating CD8+, Tconv (CD4+Foxp3−), and CD4+Foxp3+ T cells. Data are means ± SD in C (n = 6 ∼ 8; ****P < 0.0001, t test). (D) Representative flow cytometry plots of OX40hi CD4+Foxp3+ in the injected tumors. Mice were treated as described in Fig.2 A. The experiment was repeated twice. (E) Percentages and absolute number of OX40hi CD4+Foxp3+ T cells in the injected tumors. Data are means ± SD (n = 7 or 9; **P < 0.01, ****P < 0.0001, t test). (F) Percentages of CD4+Foxp3+ T cells in the injected tumors from WT and Ox40−/− mice. Mice were treated as described in Fig. 3 A. Data are means ± SD (n = 5 or 6; t test). A representative experiment is shown, repeated once. (G) Schematic diagram of IT rMVA in the presence or absence of IT αIFNAR-1 antibody in a unilateral B16-F10 melanoma implantation model. (H) Percentages of CD4+Foxp3+, CD8+Granzyme B+, and CD4+Granzyme B+ T cells in the injected tumors. Data are means ± SD (n = 6; **P < 0.01, ***P < 0.001, ****P < 0.0001, t test). A representative experiment is shown, repeated once. (I) Percentages of CD4+Foxp3+ T cells in the injected tumors in Ifnar1fl/fl and Foxp3creIfnar1fl/fl mice treated with IT rMVA or PBS. Data are means ± SD (n = 4–5; *P < 0.05, **P < 0.01, t test). A representative experiment is shown, repeated once. (J) Correlation of the percentages of OX40hi Tregs in the tumors with tumor weight. Mice were implanted with B16-F10 tumors intradermally. Tumors with different sizes were analyzed for OX40 expression on tumor-infiltrating Tregs. (K and L) Representative flow cytometry plots (K) and percentage of Tcon (conventional CD4+ T cells) proliferation (L) as measured by CellTrace Violet (CTV) dye dilution co-cultured with tumor OX40hi, OX40low, Ox40−/− Tregs, or spleen Tregs. Data are means ± SD in L (***P < 0.001, ****P < 0.0001, t test). A representative experiment is shown, repeated once.

