Figure 8.
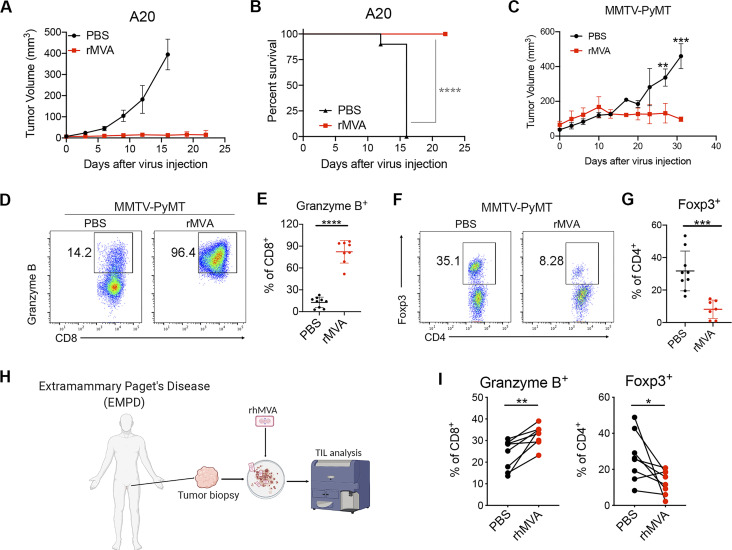
IT rMVA elicits strong antitumor immunity in multiple murine tumor models. (A) Tumor volumes over days in BALB/c mice treated with IT rMVA or PBS control in an A20 B cell lymphoma implantation model. (B) Kaplan–Meier survival curve of mice treated with IT rMVA or PBS (n = 10; ****P < 0.0001, Mantel-Cox test). A representative experiment is shown, repeated once. (C) Tumor volumes over days in the MMTV-PyMT breast tumor model. Data are means ± SD (n = 5; **P <0.01, ***P < 0.001, t test). (D) Representative flow cytometry plots of Granzyme B+CD8+ T cells in the IT rMVA- or PBS-treated tumors from MMTV-PyMT mice. A representative experiment is shown, repeated twice. (E) Percentages of Granzyme B+ CD8+ T cells in the rMVA- or PBS-injected tumors. Data are means ± SD (n = 8; ****P < 0.0001, t test). (F) Representative flow cytometry plots of Foxp3+CD4+ T cells in the rMVA- or PBS-injected tumors. (G) Percentages of Foxp3+CD4+ T cells in the rMVA- or PBS-injected tumors. Data are means ± SD (n = 8; ***P < 0.001, t test). (H) Schematic diagram of ex vivo infection of human Extramammary Paget’s disease tumors with rhMVA (MVA∆E5R-hFlt3L-hOX40L). (I) Percentages of Granzyme B+CD8+ T cells and Foxp3+CD4+ T cells in the rhMVA- or PBS-treated tumor tissues. Data are means ± SD (n = 7; *P < 0.05, **P < 0.01, t test).

