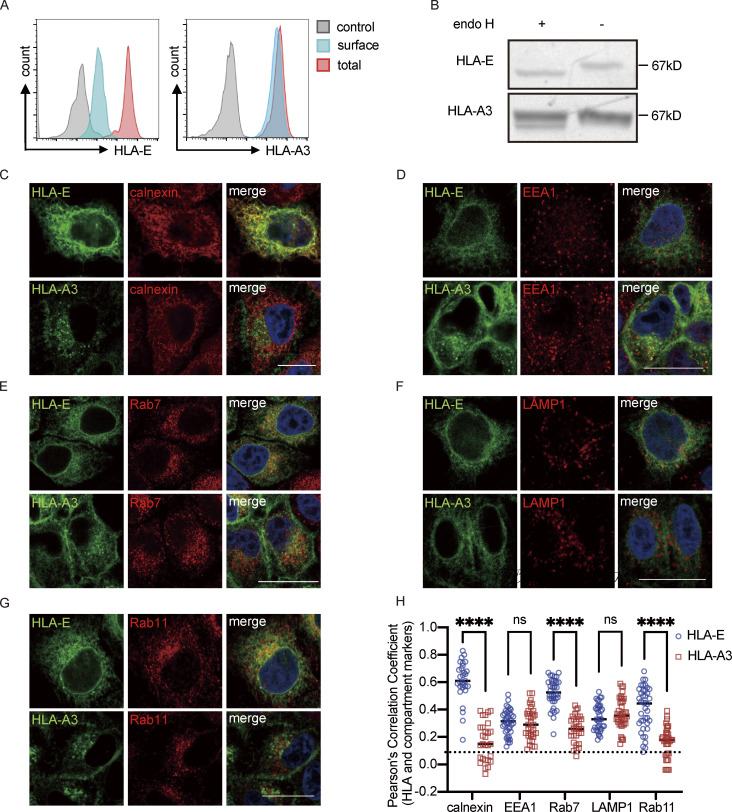
Figure 1.
Intracellular distribution of HLA-E. (A) HeLa.E or HeLa.A3 were collected for flow cytometry analysis. Representative graphs of total expression (red) and surface expression (blue) of HLA-E or HLA-A3 are shown. MFI of the unstained sample (gray) was used as the negative control. MFIs shown here are representative of observations made in six independent experiments. (B) Lysates of HeLa.E or HeLa.A3 were treated with Endo H, followed by detection with immunoblotting using an anti-EGFP antibody. Figures shown here are representative of three independent experiments. (C–G) Representative micrographs of HeLa.E or HeLa.A3. After fixation and permeabilization, cells were stained with antibodies against marker proteins for ER (calnexin; C), early endosome (EEA1; D), late endosome (Rab7; E), lysosome (LAMP1; F), and recycling endosome (Rab11; G), followed by detection with Alexa568-conjugated secondary antibody. Scale bars = 20 μm. Micrographs shown here are representative of two independent experiments. (H) Quantification of colocalization of HLA-E or HLA-A3 with different marker proteins from Fig. 1, C–G. The PCC values of each cell and the mean values are shown with 20–40 cells per sample. Statistical analysis was performed using unpaired two-tailed Student’s t test with Welch’s correction. Asterisks show the statistical significance between indicated groups: ns, not significant; ****, P < 0.0001. Source data are available for this figure: SourceData F1.

