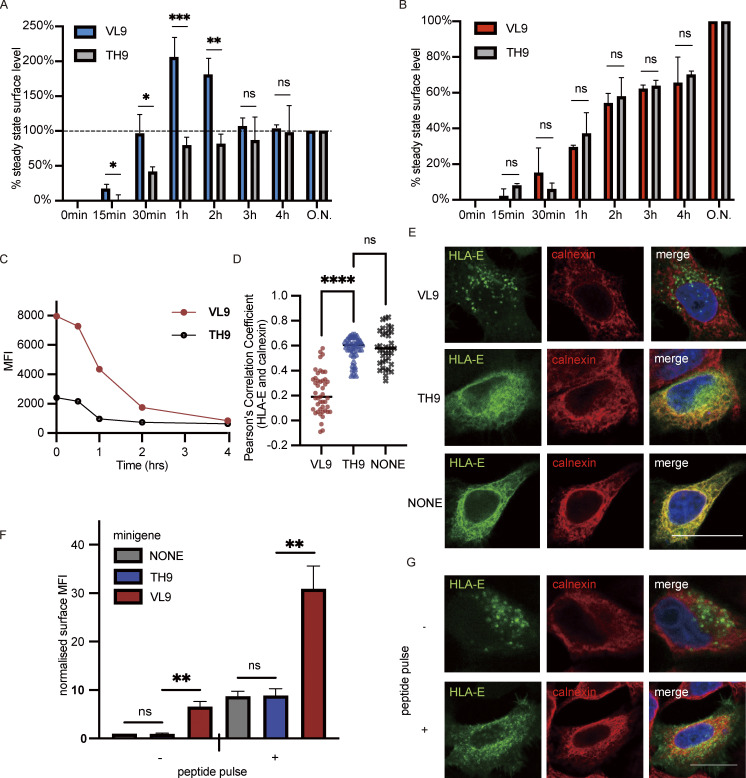
Figure 4.
VL9 peptide increases HLA-E surface expression mainly by promoting ER export. (A and B) HEK 293T cells were transiently cotransfected with different peptide minigenes and the RUSH system with Sec61B-streptavidin as the hook and HLA-E_SBP_EGFP (A) or HLA-A3_SBP_EGFP (B) as the reporter protein. At different time points after biotin addition, the surface expression of HLA-E or HLA-A3 was assessed. The stable cell surface MFI after the biotin addition overnight was set to 100%, the MFI before biotin addition was set to 0%, and the other values were normalized accordingly. Data were collected for three biological runs and are shown as mean ± SD (error bars). (C) HEK 293T cells transiently cotransfected with HLA-E_EGFP and different peptide minigenes were incubated in media containing BFA for different time points, and surface expression of HLA-E molecules was assessed. The average cell surface MFIs are shown, and the results are representative of observations made in three experiments. (D and E) HeLa cells were transiently transfected with HLA-E_EGFP or co-transfected with HLA-E_EGFP and different peptide minigenes. Cells were fixed, permeabilized, and stained with an antibody against the ER marker protein calnexin, followed by detection with an Alexa647-conjugated secondary antibody. (D) Quantification of ER colocalization. PCC was calculated for 30–50 individual cells, and the PCC values of each cell and the mean values are shown. (E) Representative confocal micrographs of different conditions. Scale bar = 20 μm. Micrographs shown here are representative of two independent experiments. (F) HEK 293T cells were transiently cotransfected with HLA-E_EGFP and different peptide minigenes. 8 h after transfection, VL9 peptide (100 μM final) was added to the peptide pulse–positive group, and an equal amount of DMSO was added to the peptide pulse–negative group as the control. 24 h after transfection, cells were collected for flow cytometry analysis. The surface expression of HLA-E was normalized to the MFI of the control group with neither minigene transfection nor peptide pulse treatment. (G) Representative micrographs of HeLa cells transiently transfected with HLA-E_EGFP and VL9 peptide minigene. 8 h after transfection, VL9 peptide (100 nM) was added to the peptide pulse–positive group, and an equal amount of DMSO was added to the peptide pulse–negative group as the control. 24 h after transfection, cells were fixed, permeabilized, and stained with an antibody against the ER marker protein calnexin, followed by detection with an Alexa647-conjugated secondary antibody. Scale bar = 20 μm. Micrographs shown here are representative of two independent experiments. Statistical analysis was performed using unpaired two-tailed Student’s t test with Welch’s correction (A and B) or one-way ANOVA with Tukey’s post-hoc test (D and F). Asterisks show the statistical significance between indicated groups: ns, not significant; *, P < 0.05; **, P < 0.01; ***, P < 0.001; ****, P < 0.0001.

