Figure 7.
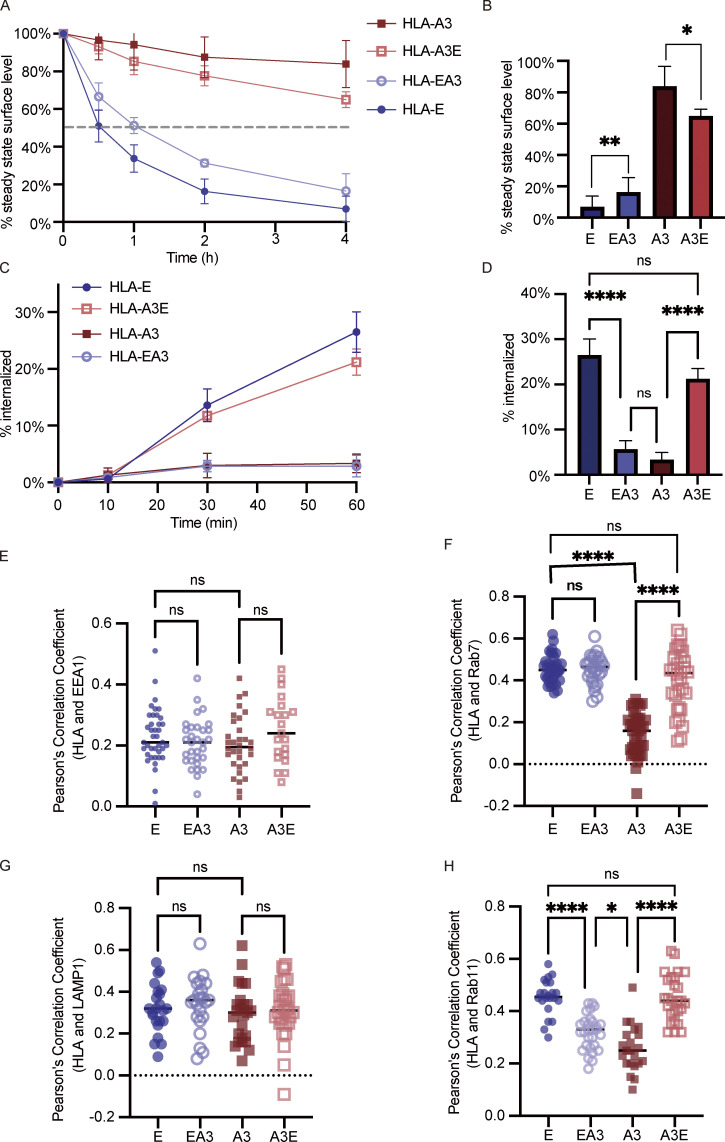
HLA-E cytoplasmic tail facilitates internalization and endosomal enrichment. (A and B) HeLa cells stably expressing different HLA constructs were incubated in media containing BFA for different time points, and surface expression of HLA molecules was assessed. (A) The average cell surface MFI for time point zero was set to 100% and the following values were normalized as their percentage. The dashed line represents 50%. (B) The percentage of HLA on the cell surface after BFA incubation for 4 h. Data were collected for four biological runs and are shown as mean ± SD (error bars). (C and D) Surface HLA molecules of HeLa stable cell lines were labeled, and then the cells were incubated in media containing primaquine. After different time points of internalization, samples were collected, and uninternalized surface antibody–HLA complexes were stripped off using citric acid. (C) The MFI of antibody-labeled cells without acid stripping was set to 100%, and the MFI of antibody-labeled cells with acid stripping but without internalization was set to 0%. The percentage of internalization was quantified by the normalization of MFI increase accordingly. (D) The percentage of HLA internalized after 1 h. Data were collected for four biological runs and are shown as mean ± SD (error bars). (E–H) HeLa cells stably expressing different HLA constructs were fixed, permeabilized, and stained with antibodies against protein markers for early endosome (EEA1; E), late endosome (Rab7; F), lysosome (LAMP1; G), or recycling endosome (Rab11; H). Cells were then stained with Alexa568-conjugated secondary antibody. The colocalization of HLA-E, HLA-EA3, HLA-A3, and HLA-A3E with different endosomal compartment markers was quantified using PCC, with 20–40 cells per sample. The PCC values of each cell and the mean values are shown. Micrographs shown here are representative of two independent experiments. Statistical analysis was performed using one-way ANOVA with Tukey’s post-hoc test. Asterisks show the statistical significance between indicated groups: ns, not significant; *, P < 0.05; **, P < 0.01; ****, P < 0.0001.

