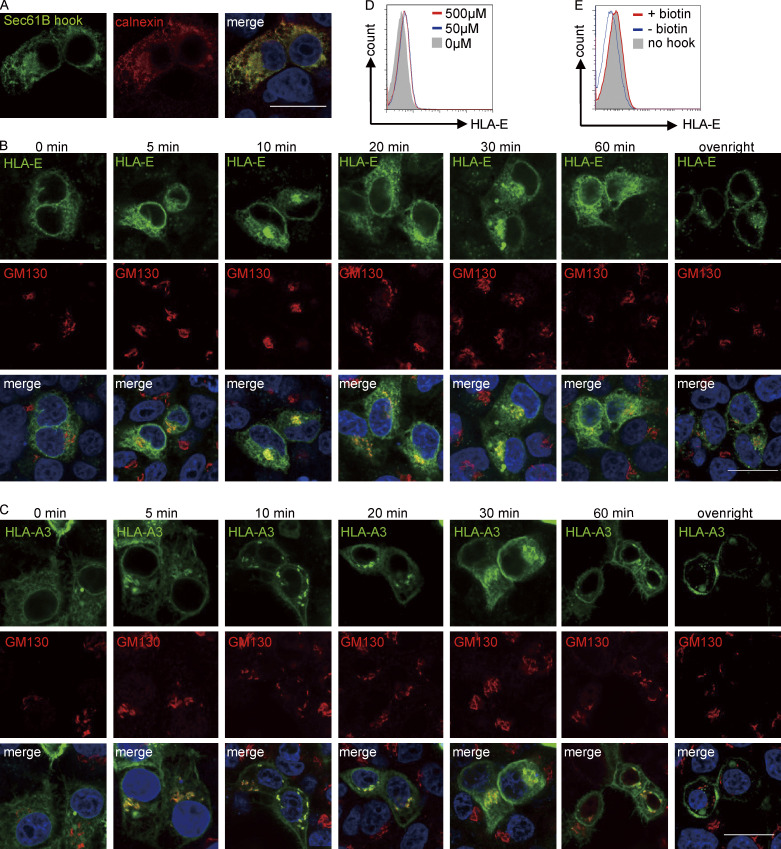
Figure S2.
Application of the RUSH system to study intracellular transport. (A) Representative micrographs of HeLa cells transiently expressing the hook Sec61B_streptavidin. Cells were fixed, permeabilized, and stained with a mouse antibody against streptavidin and a rabbit antibody against the ER marker protein calnexin, followed by detection with anti-mouse Alexa488 and anti-rabbit Alexa568 secondary antibodies. Scale bar = 20 μm. Micrographs shown here are representative of two independent experiments. (B and C) Representative micrographs of HeLa cells transiently expressing Sec61B_streptavidin and HLA-E_SBP_EGFP (B) or HLA-A3_SBP_EGFP (C). At different time points after biotin addition, cells were fixed, permeabilized, and stained with an antibody against the Golgi marker protein GM130, followed by detection with an Alexa568-conjugated secondary antibody. Scale bars = 20 μm. Micrographs shown here are representative of two independent experiments. (D) HEK 293T cells were transiently cotransfected with Sec61B-streptavidin and HLA-E_SBP_EGFP. 8 h after transfection, different concentrations of biotin were added. 24 h after transfection, cells were collected for flow cytometry analysis, and surface expression of HLA-E was assessed. MFIs shown here are representative of observations made in three independent experiments. (E) HEK 293T cells were transiently transfected with HLA-E_SBP_EGFP (gray area) or cotransfected with Sec61B-streptavidin and HLA-E_SBP_EGFP (red and blue lines). 8 h after transfection, biotin (50 μM final) was added to the +biotin group (red line). 24 h after transfection, cells were collected for flow cytometry analysis, and surface expression of HLA-E was assessed. MFIs shown here are representative of observations made in three experiments.

