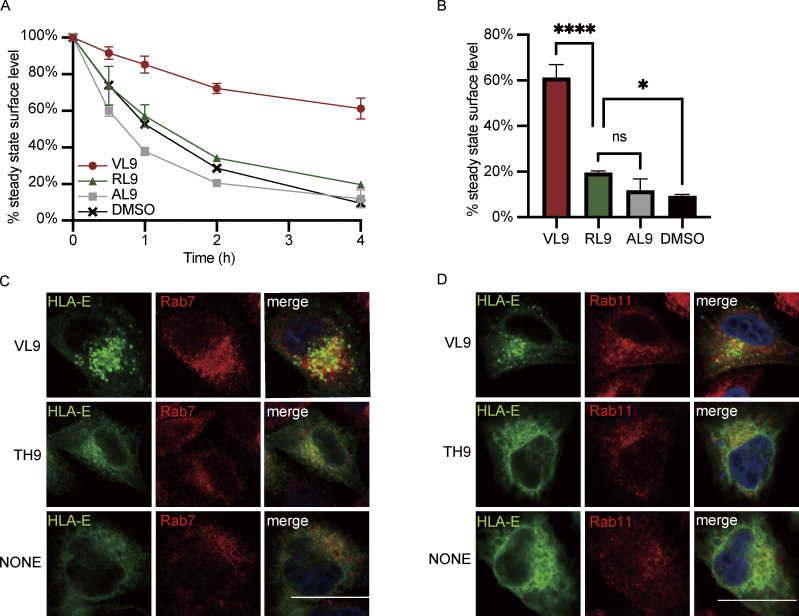
Figure S3.
Functions of HLA-E peptides. (A and B) K562E cells were first incubated in media containing different peptides for 3 h before BFA addition. After BFA incubation for different time points, the surface expression of HLA-E molecules was assessed. (A) The average cell surface MFI for time point zero of each sample was set to 100% and the following values were normalized as its percentage. (B) Percentage of surface HLA-E after BFA incubation for 4 h. MFIs were collected and plotted for three biological runs, and data are shown as mean ± SD (error bars). Statistical analysis was performed using one-way ANOVA with Tukey’s post-hoc test. Asterisks show the statistical significance between indicated groups: ns, not significant; *, P < 0.05; ****, P < 0.0001. (C and D) Representative micrographs of HeLa cells transiently transfected with HLA-E_EGFP or cotransfected with HLA-E_EGFP and different peptide minigenes. Cells were fixed, permeabilized, and stained with antibodies against protein markers of the late endosome (Rab7; C) or the recycling endosome (Rab11; D). Cells were then stained with Alexa647-conjugated secondary antibody. Scale bar = 20 μm. Micrographs shown here are representative of two independent experiments.

