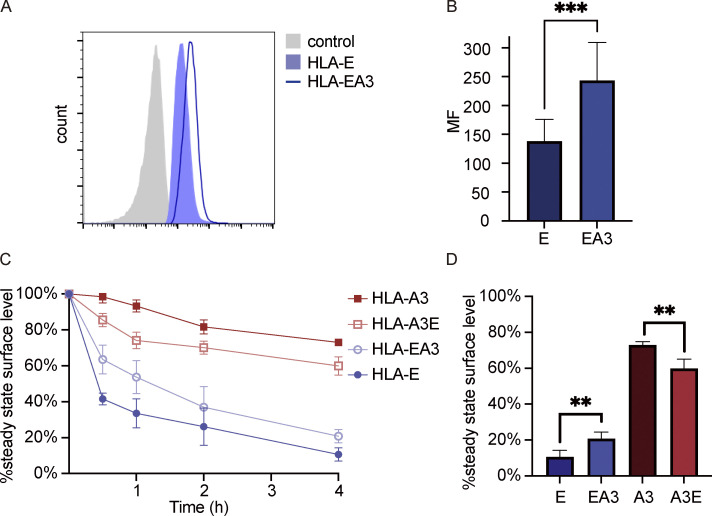
Figure S4.
EGFP tagging does not seem to significantly affect the function of HLA-E cytoplasmic tail. (A and B) HEK293T cells were transiently cotransfected with EGFP and HLA-E or HLA-EA3 without EGFP tagging. 24 h after transfection, cells were collected for flow cytometry analysis (gated on GFP+ cells). Expression of HLA molecules was assessed with anti-HLA-E antibody (3D12). (A) Representative graph of surface MFI of HLA-E (light blue area) and HLA-EA3 (dark blue line). MFI of unstained samples (gray area) was used as the negative control. MFI shown here is representative of the observations made in five experiments. (B) MFI were collected and plotted for five biological runs, and data were shown as mean ± SD (error bars). (C and D) HEK293T cells were transiently cotransfected with EGFP and different HLA constructs without EGFP tagging. 24 h after transfection, cells were incubated in media containing BFA for different time points, and the surface expression of HLA molecules was assessed. (C) The average cell surface MFI for time point zero was set to 100% and the following values were normalized as its percentage. (D) The percentage of HLA on the cell surface after BFA incubation for 4 h. Data were collected for six biological runs and are shown as mean ± SD (error bars). Statistical analysis was performed using paired (B) or unpaired (D) two-tailed Student’s t test. Asterisks show the statistical significance between indicated groups: **, P < 0.01; ***, P < 0.001.

