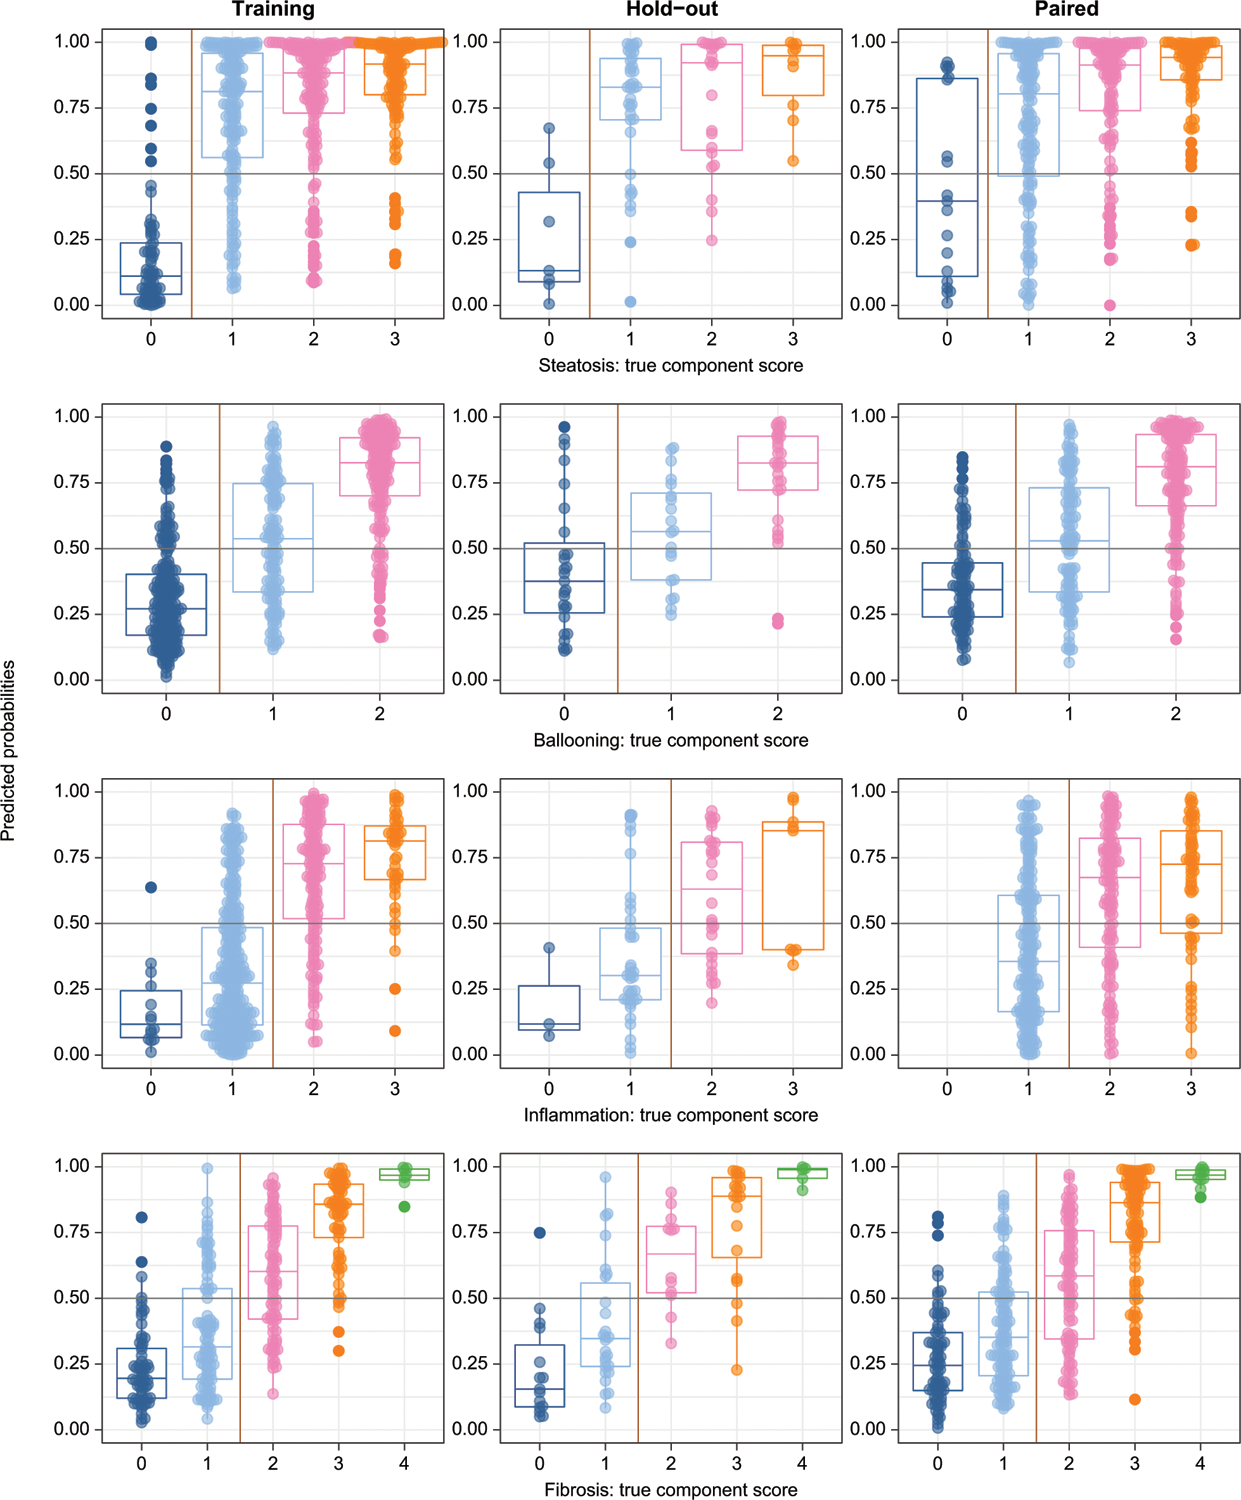
Fig. 2. Model predictions vs. observed biopsy results in the training, hold-out validation, and paired validation data sets.

Models were trained on dichotomized variables (left and right of vertical yellow lines). Probability outputs of the models (probability of any given sample being in the positive class) are displayed by the original biopsy grade. The decision threshold for all models was greater than or equal to 0.5 (horizontal gray lines). Boxes show medians, 25th and 75th centiles. By random chance there were no zero inflammation scores in the paired validation set. Training: left panels; Hold-out validation: center panels; Paired validation: Right panels.
