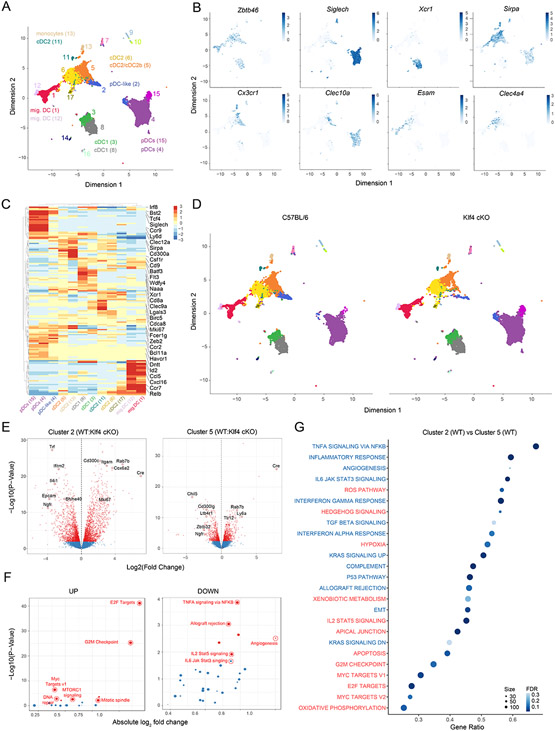
Figure 5. Selective Klf4 deficiency profoundly alters pDC-like signature.
(A-G) scRNA-seq on CD11c+ enriched and sort-purified DCs isolated from spleens, sLN and mLN derived from C57BL/6 (WT) or Klf4fl/flCD11cCre+ (Klf4-cKO) mice performed and analyzed as explained in methods. (A) Shown are all cells colored based on cluster distribution and projected on a UMAP 2D-space. (B) Shown are UMAP plots depicting the expression for the indicated genes obtained for WT cells. (C) Shown is a relative expression heatmap of the top 50 DEGs across all clusters. (D) Shown are UMAP plots depicting cells obtained from WT or Klf4-cKO mice as indicated. (E) Volcano plots showing pair-wise comparisons between WT and Klf4-cKO cells from cluster 2 (left) or cluster 5 (right). (F) GSEA performed on the Molecular Signature Database (MSigDb v5.2) comparing the enrichment score (ES) obtained for WT and Klf4-cKO cells from cluster 2. Pathways were plotted based on up (left) or down-regulation in Klf4-cKO versus WT cells (right). (G) GSEA dot plot analysis showing the most enriched pathways between cluster 2 and 5 for cells obtained from WT mice. Pathways are colored based on their down (blue) or up-regulation (red) in cluster 2 (FDR= false discovery rate).

