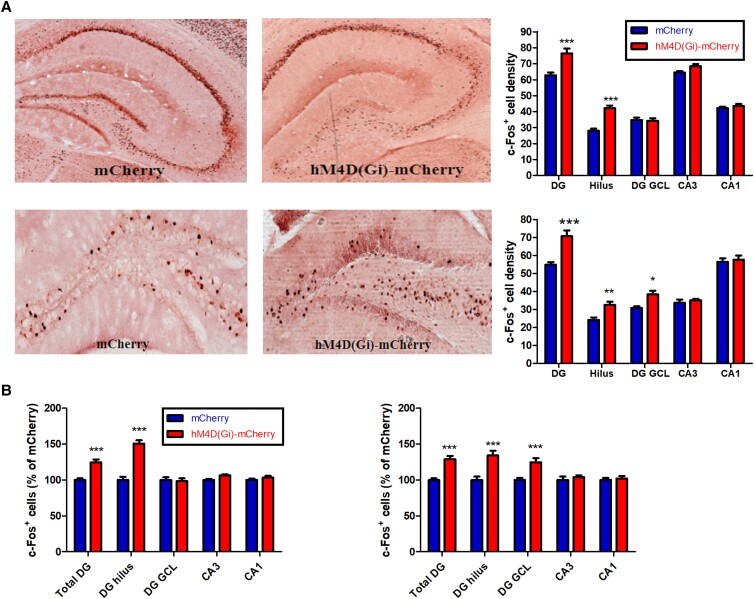
Fig. 2.
c-Fos+ cell counts in hippocampal subfields [total DG, DG hilus, DG granule cell layer (DG GCL), CA3, and CA1]. A) Top: representative sections showing c-Fos expression in AAV-hSyn-DIO-mCherry mice (“mCherry” mice) and AAV-hSyn-DIO-hM4D(Gi)-mCherry mice (“hM4D(Gi)-mCherry” mice) during CCI. Bottom: representative sections showing c-Fos expression in mCherry and hM4D(Gi)-mCherry mice during SCI. B) Left: estimated density of c-Fos+ cells in the hM4D(Gi)-mCherry mice after CCI, normalized to the number of c-Fos+ cells in the mCherry control mice. Right: estimated density of c-Fos+ cells in the hM4D(Gi)-mCherry mice after SCI, normalized to the number of c-Fos+ cells in the mCherry control mice. *P < 0.05, **P < 0.01, and ***P < 0.001 compared with the corresponding mCherry control group.

