
Figure 3 -. Cell contractile behavior is modulated by heterogeneous architecture.
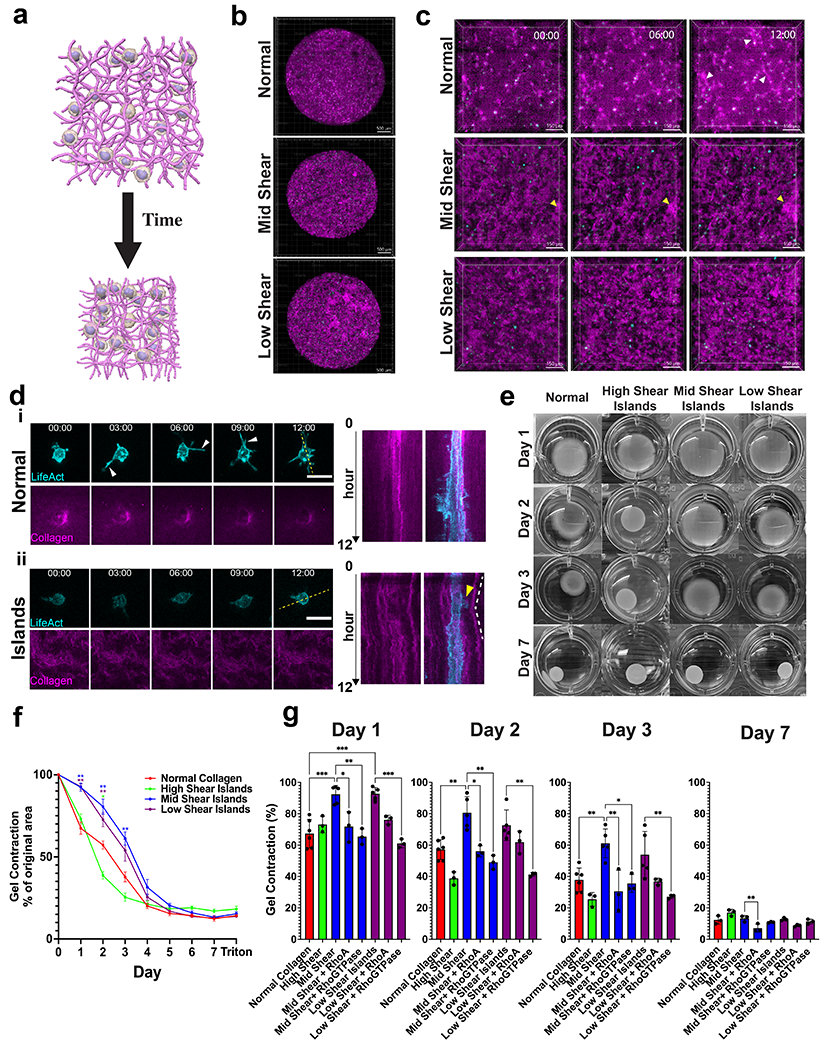
(a) Schematic of gel compaction assay. (b) Representative timelapse and (c) zoomed in images of MSCs in smaller gel volumes over 12 hours. White arrows indicate plastic gel tracks formed between cells. Yellow arrows indicate island architecture movement. Scalebar for (b) is 500 μm and for (c) is 150 μm. (d) Representative images and kymograph for MSCs cultured in (i) normal or (ii) mid shear island gels. Yellow arrow indicates dynamic protrusion and white lines indicate island architecture movement. Scale bar is 30 μm. (e) Gel compaction for MSCs (6x10⁵ cells/ml) for varied island architectures over 7 days. N ≥ 3, mean ± sem. (f) 7 day time course of MSCs cultured in each island architecture . (g) Quantified gel compaction area at days 1,2,3 and 7 for each island gel. N ≥ 3, mean ± sd. Magenta is stained collagen and cyan is MSC-LifeAct cells. * p < 0.05; **, p < 0.01; ***p < 0.0001 by one-way ANOVA.