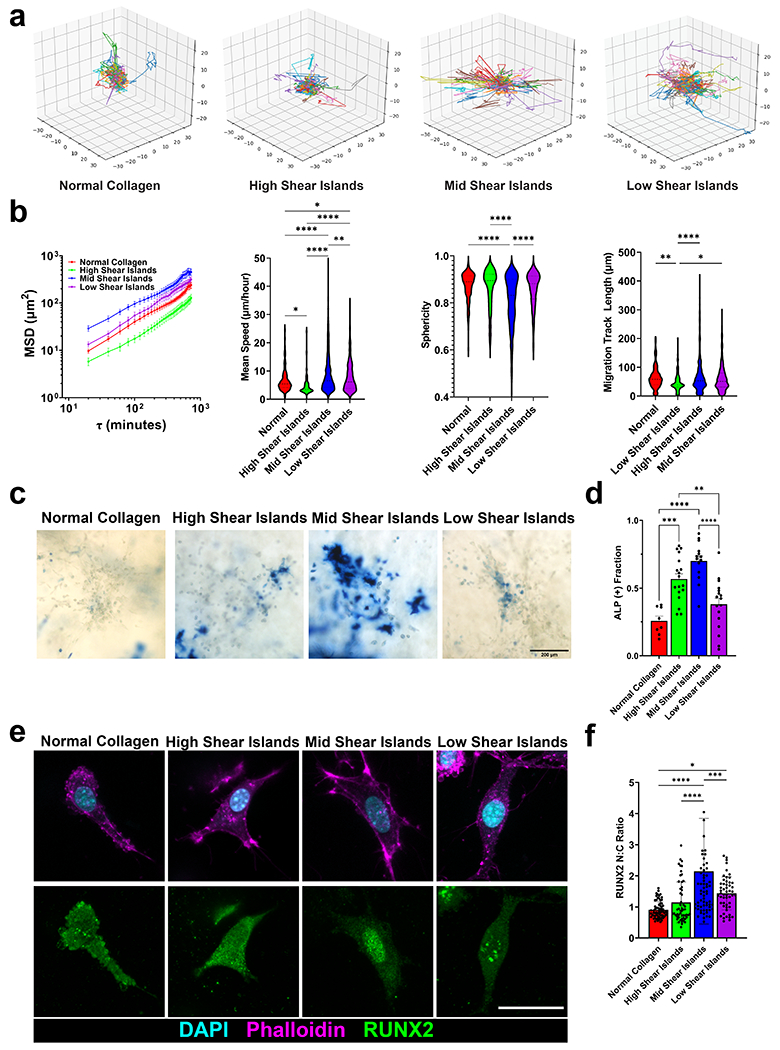
Figure 4 -. MSC migratory and differentiation behaviors are modulated by island architecture.

(a) Representative 3D track reconstructions for cell migration in island architectures. (b) Mean squared displacements, mean speeds, sphericity, and migration track length for migrating cells. N = 3, n > 200 cells. (c) Representative images of alkaline phosphatase staining (blue), indicating early osteogenic differentiation, for MSC cultured in island gels for 7 days. Scale bar is 200 μm. (d) Corresponding ALP (+) fraction of cells. n ≥ 3 images from 3 independent replicates. (e) Representative images of RUNX2 (green), DAPI (cyan), and F-actin (magenta) of MSCs cultured in island gels for 7 days. (f) Corresponding RUNX2 nuclear to cytoplasmic ratio of cells cultured in each island gel. N=3, n > 53 cells. Scale bar is 30 microns. mean ± sd * p < 0.05; **, p < 0.01; ***p < 0.0001 by one-way ANOVA.
