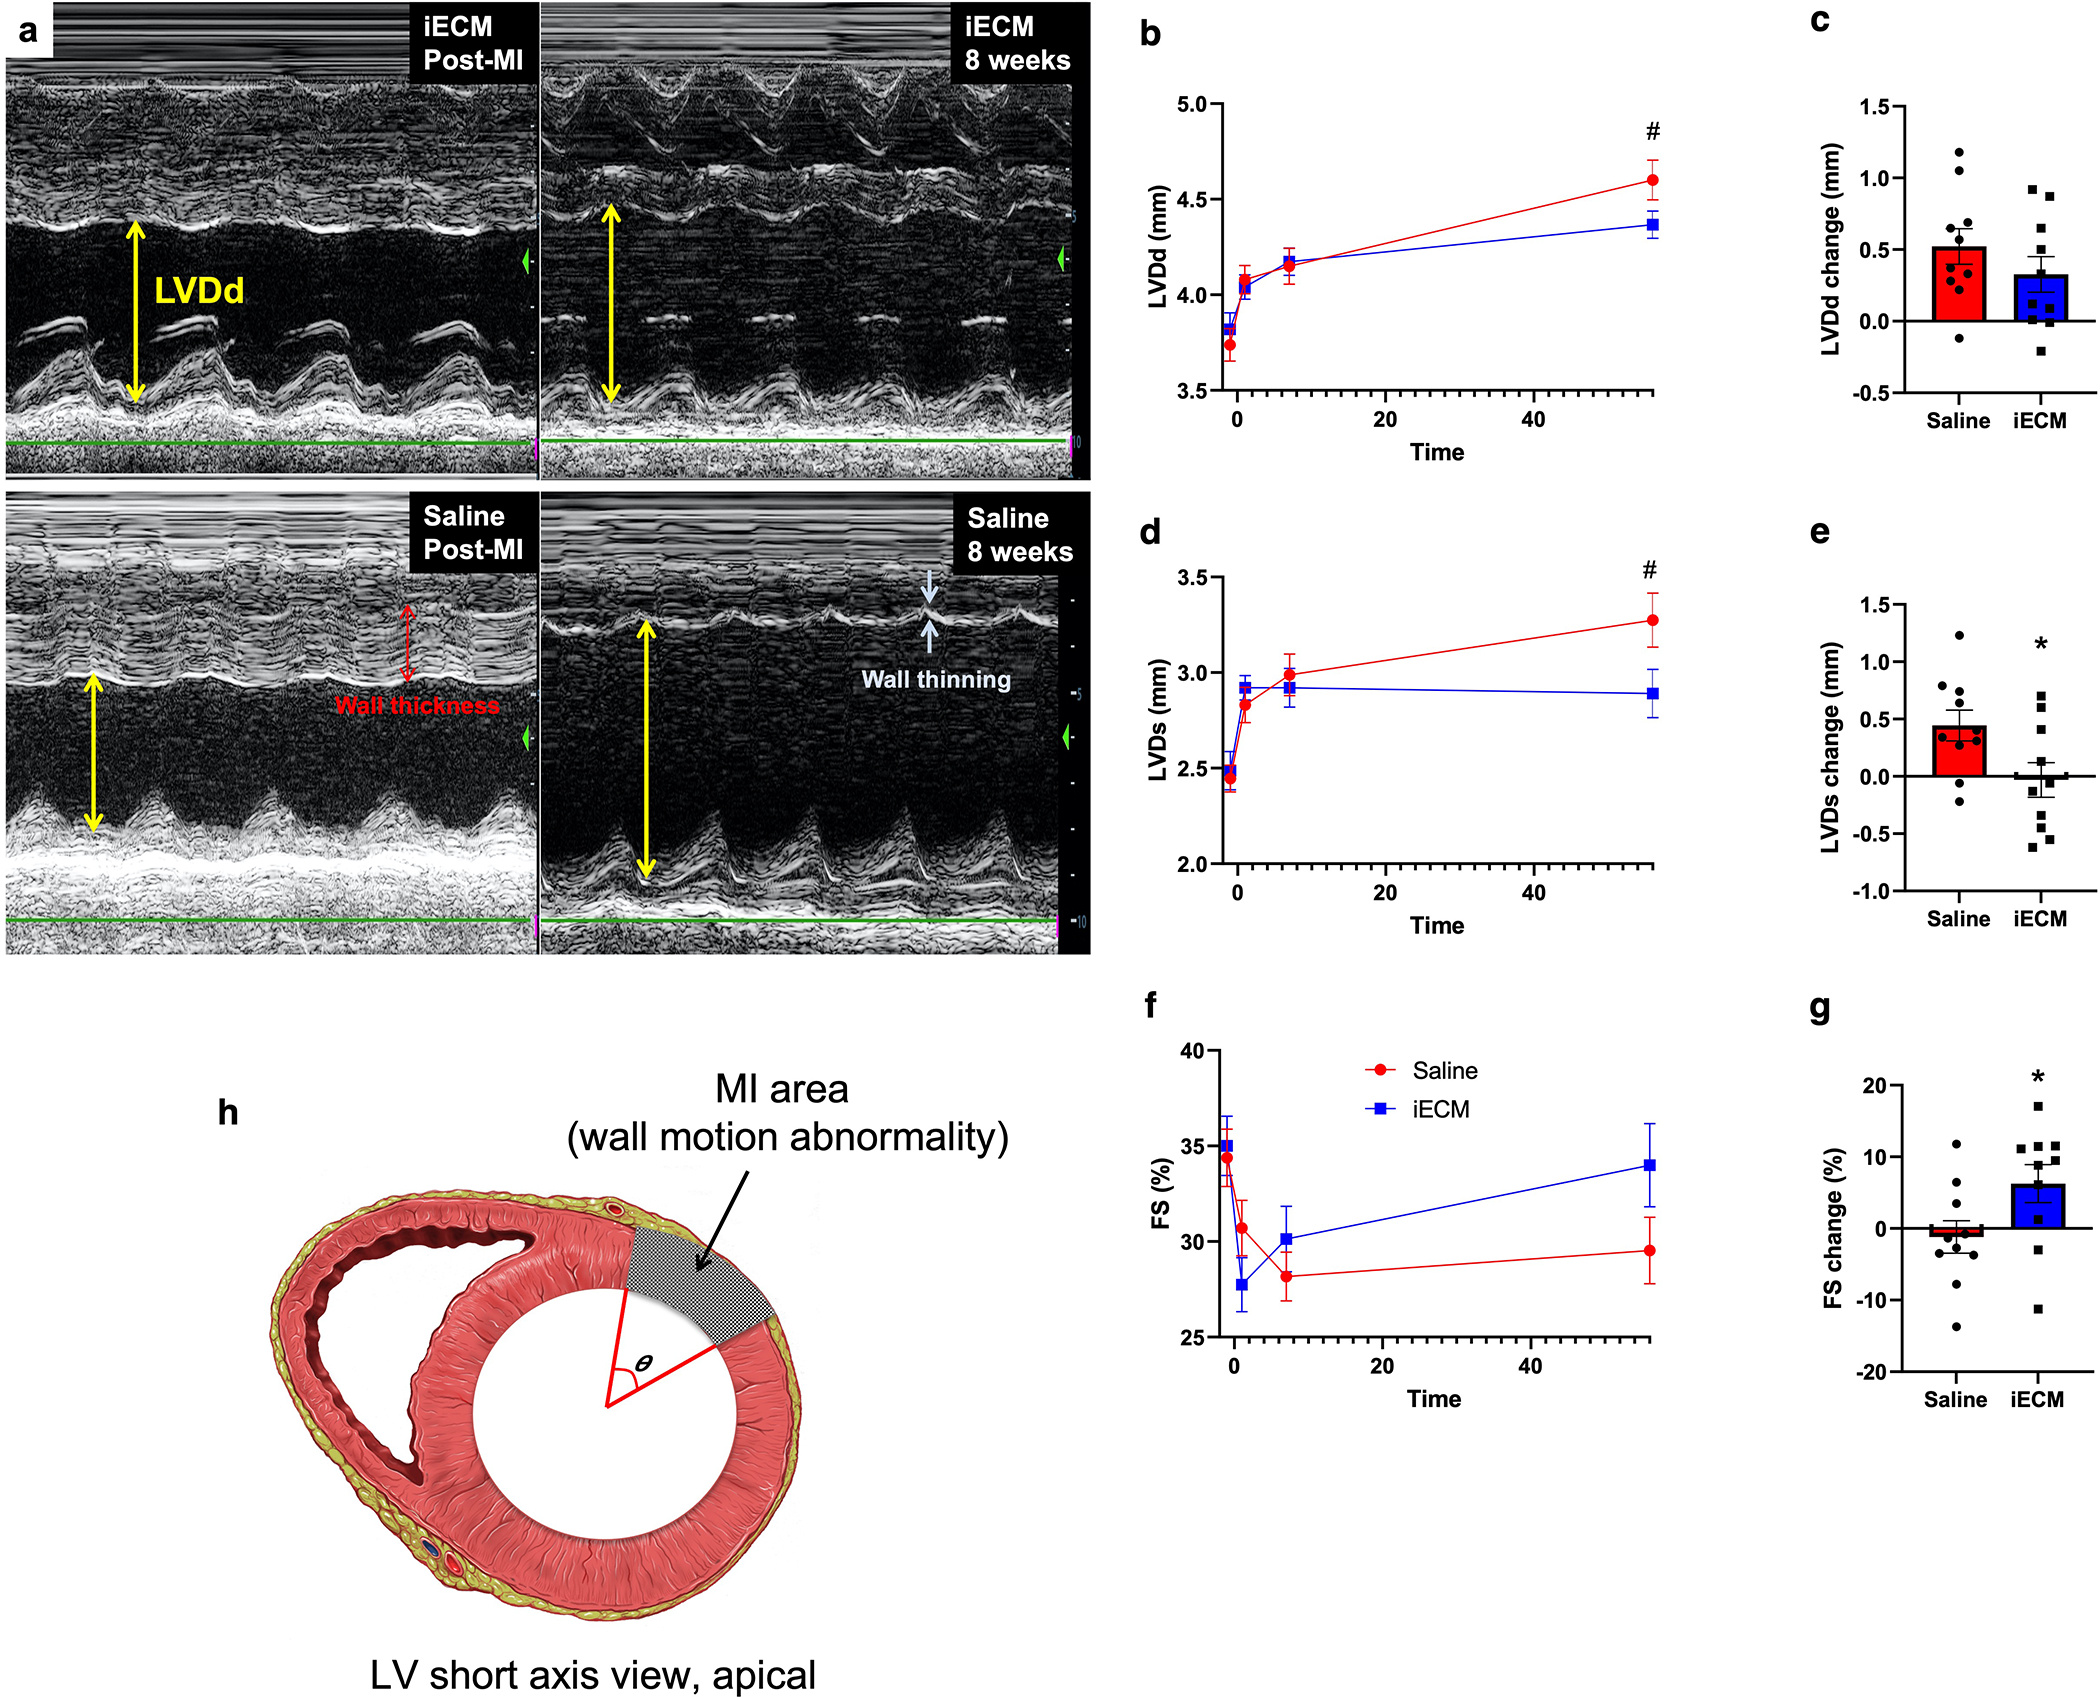
Extended Data Fig. 4 |. Additional echocardiography results showing that iECM infusions mitigate negative LV remodeling in a pig acute MI model.

a, Representative M-mode echocardiographic images showing that iECM mitigates negative LV remodeling. Yellow arrows represent LV diastolic dimension, red arrows represent wall thickness, and white arrows represent wall thinning. b-g, LV diastolic dimension (LVDd, #p=0.08), LV systolic dimension (LVDs), and fractional shortening (FS) over time (b,d,f) and changes from post-MI to 8 weeks post-MI (c, e (*p=0.03), g (*p=0.047)). h, Diagram demonstrating how infarct angle was measured. N=10 all groups. Data are mean ± SEM. All data are biological replicates and were evaluated with a two tailed unpaired t-test.
