Figure 2:

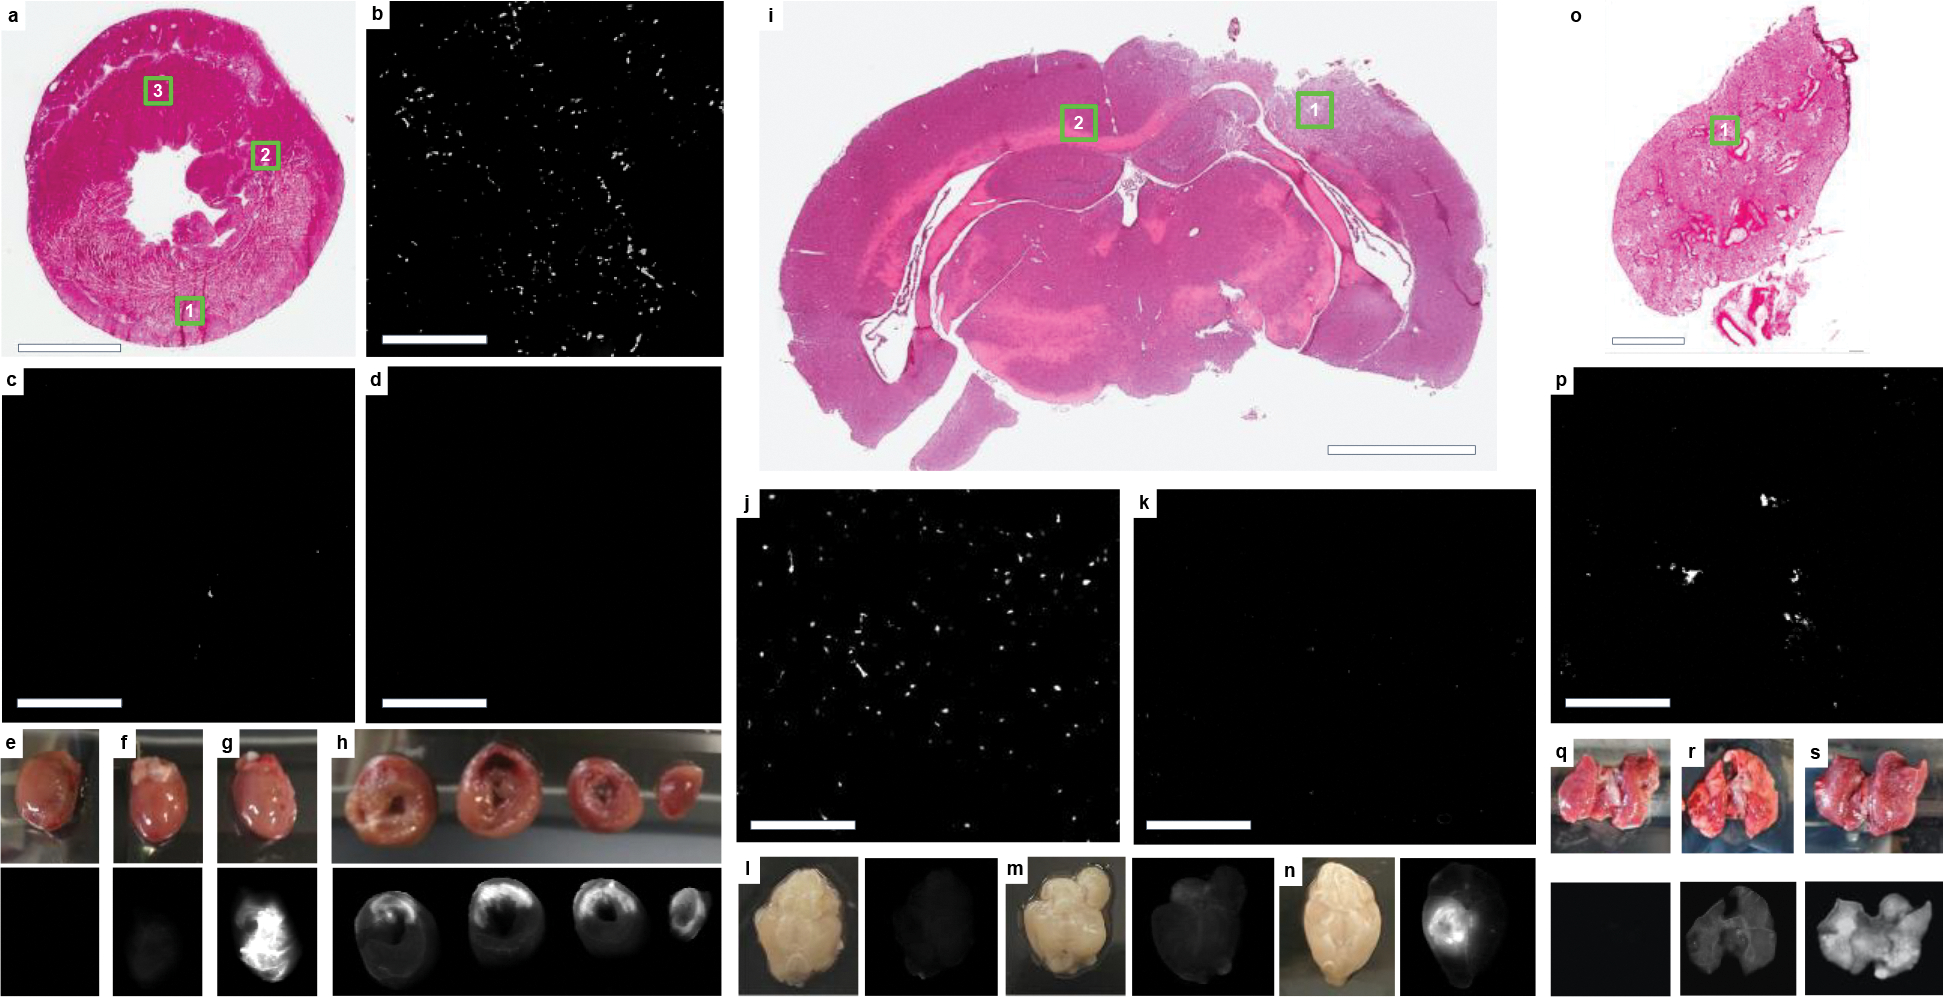
iECM infusions target injured tissues. a, H&E short axis section of an acute MI heart following iECM infusion, scale bar 3 mm. b-d, Fluorescence images for locations shown in insets in a of infarcted myocardium (b, 1), neighboring myocardium (c, 2), and remote myocardium (d, 3), scale bars are 200 μm. e-h, Heart near-infrared scans of saline without dye (e), trilysine conjugated with VivoTag®-S 750 (VT750) (f), and iECM conjugated with VT750 (g). h, Short axis slices of an iECM infused heart from the base to the apex (left to right), infarct regions oriented in the upper portion of the slices. iECM tracking using VT750 24 hours following infusion and MI procedure. i, H&E section of a brain following traumatic brain injury (TBI) and iECM infusion. j-k, Fluorescence images for locations shown in insets in i of injured brain (j, 1) or remote brain (k, 2). Near-infrared scans of brain infused with saline without dye following TBI (l), healthy brain infused with iECM conjugated with VT750 (m), and brain infused with iECM conjugated with VT750 following TBI (n). o, H&E section of a lung following monocrotaline injury, a model of pulmonary arterial hypertension (PAH), and iECM infusion. p, Fluorescence image for location shown in inset in o of injured lung (1). Lung near-infrared scans of lung infused saline without dye following PAH (q), healthy lung infused with iECM conjugated with VT750 (r), and lung infused with iECM conjugated with VT750 following PAH (s).
