Figure 3:

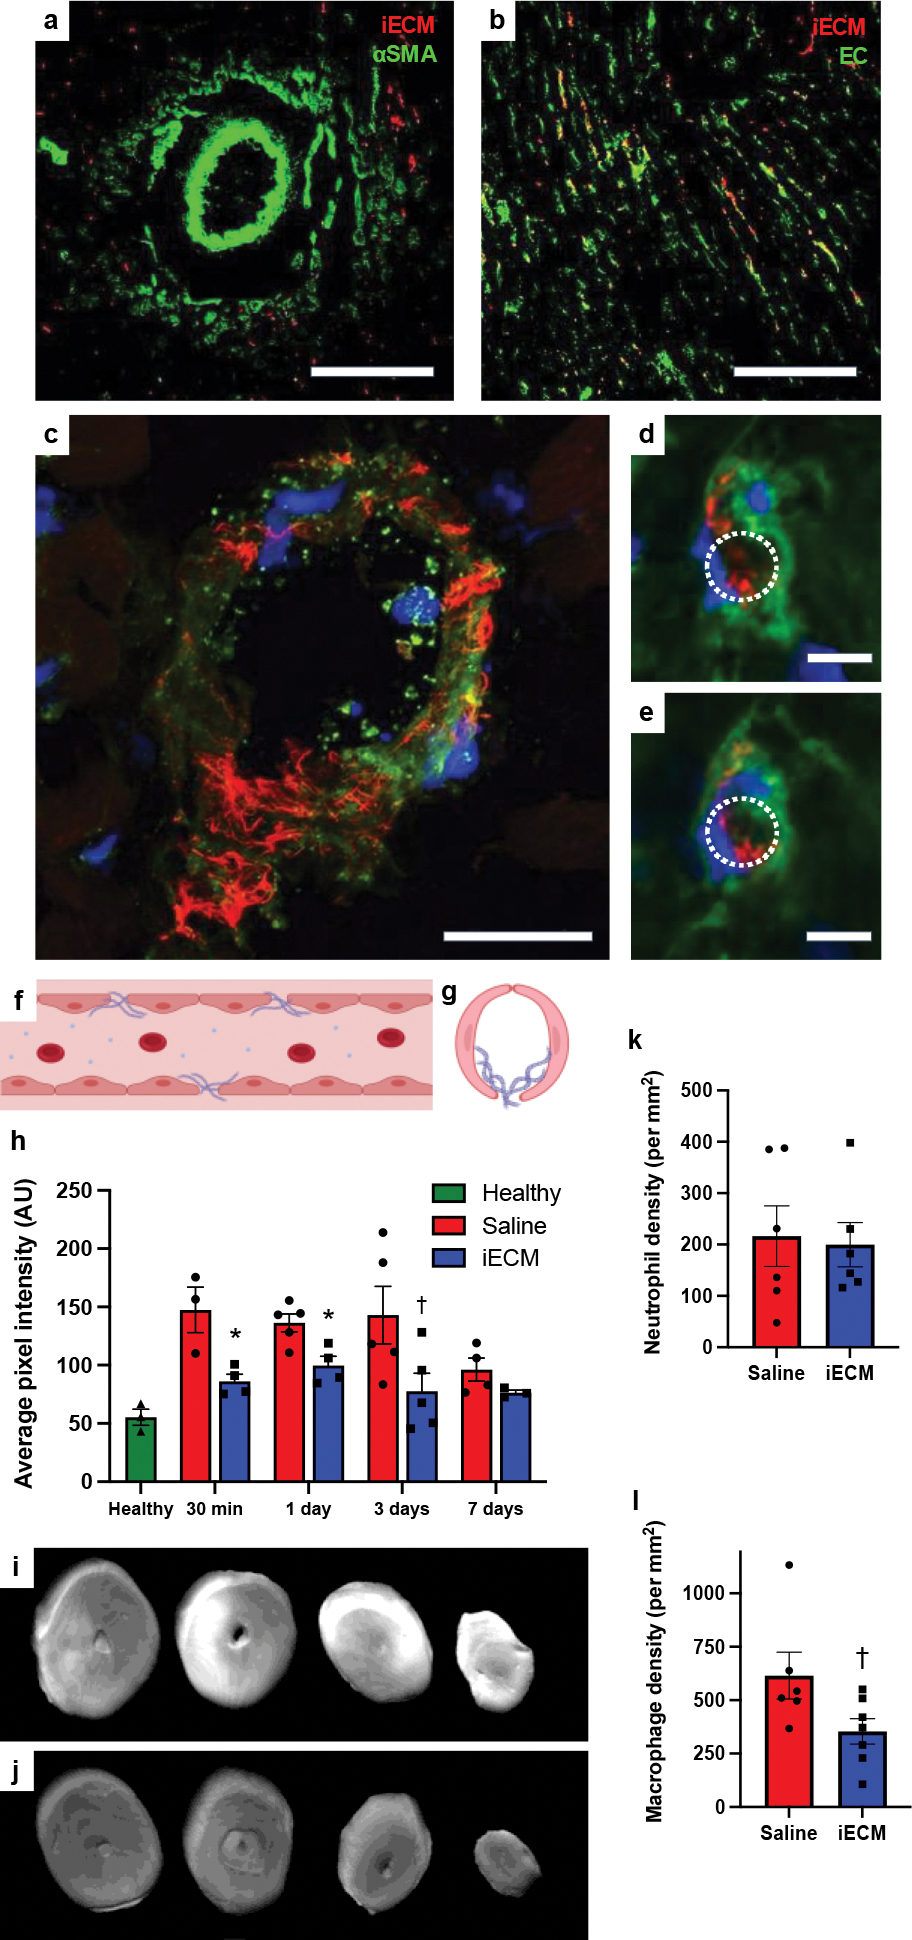
iECM colocalizes with the microvasculature, and reduces vascular permeability and macrophage density after MI. iECM was pre-labeled and visualized in red in all parts of Fig. 3. a, Staining for arterioles using anti-alpha smooth muscle actin (αSMA) in green. (b-e), Staining for endothelial cells using isolectin in green. Scale bar is 200 μm for a-b. c, iECM does not block the lumen of an arteriole but fills in the gaps in the endothelium. Scale bar is 25 μm. d,e, Representative sequential z-stack images of a capillary showing that iECM binds to the endothelium while not blocking it. Lumen traced with dotted white lines. Scale bar is 5 μm. f, Diagram of longitudinal axis view of iECM fibers binding in a leaky vessel. g, Diagram of short axis view of iECM binding in a capillary. h, Quantified cardiac tissue signal intensity following MI, intracoronary infusion, and IV BSA, suggesting iECM infusions decrease tissue permeability and accelerate vascular healing. BSA signal was measured at 30 min (n=3 saline, n=4 iECM, *p=0.02) and 1 (n=5 saline, n=4 iECM, *p=0.01), 3 (n=5 saline, n=5 iECM, †p=0.055), and 7 (n=4 saline, n=3 iECM) days after infusion in the MI model, and in a healthy animals (n=3) 30 min after infusion. i-j, Fluorescent scans of hearts 30 min following MI, intracoronary infusion of saline (i) or iECM (j), and IV infusion of fluorescent bovine serum albumin (IV BSA). (k) Neutrophil (n=6 saline, n=6 iECM) and (l) macrophage density (n=6 saline, n=7 iECM, †p=0.05) in the infarct area of rats one and three post-MI and infusion, respectively. Data are mean ± SEM. All data are biological replicates. Data were evaluated with a two tailed unpaired t-test. f,g created with Biorender.com
