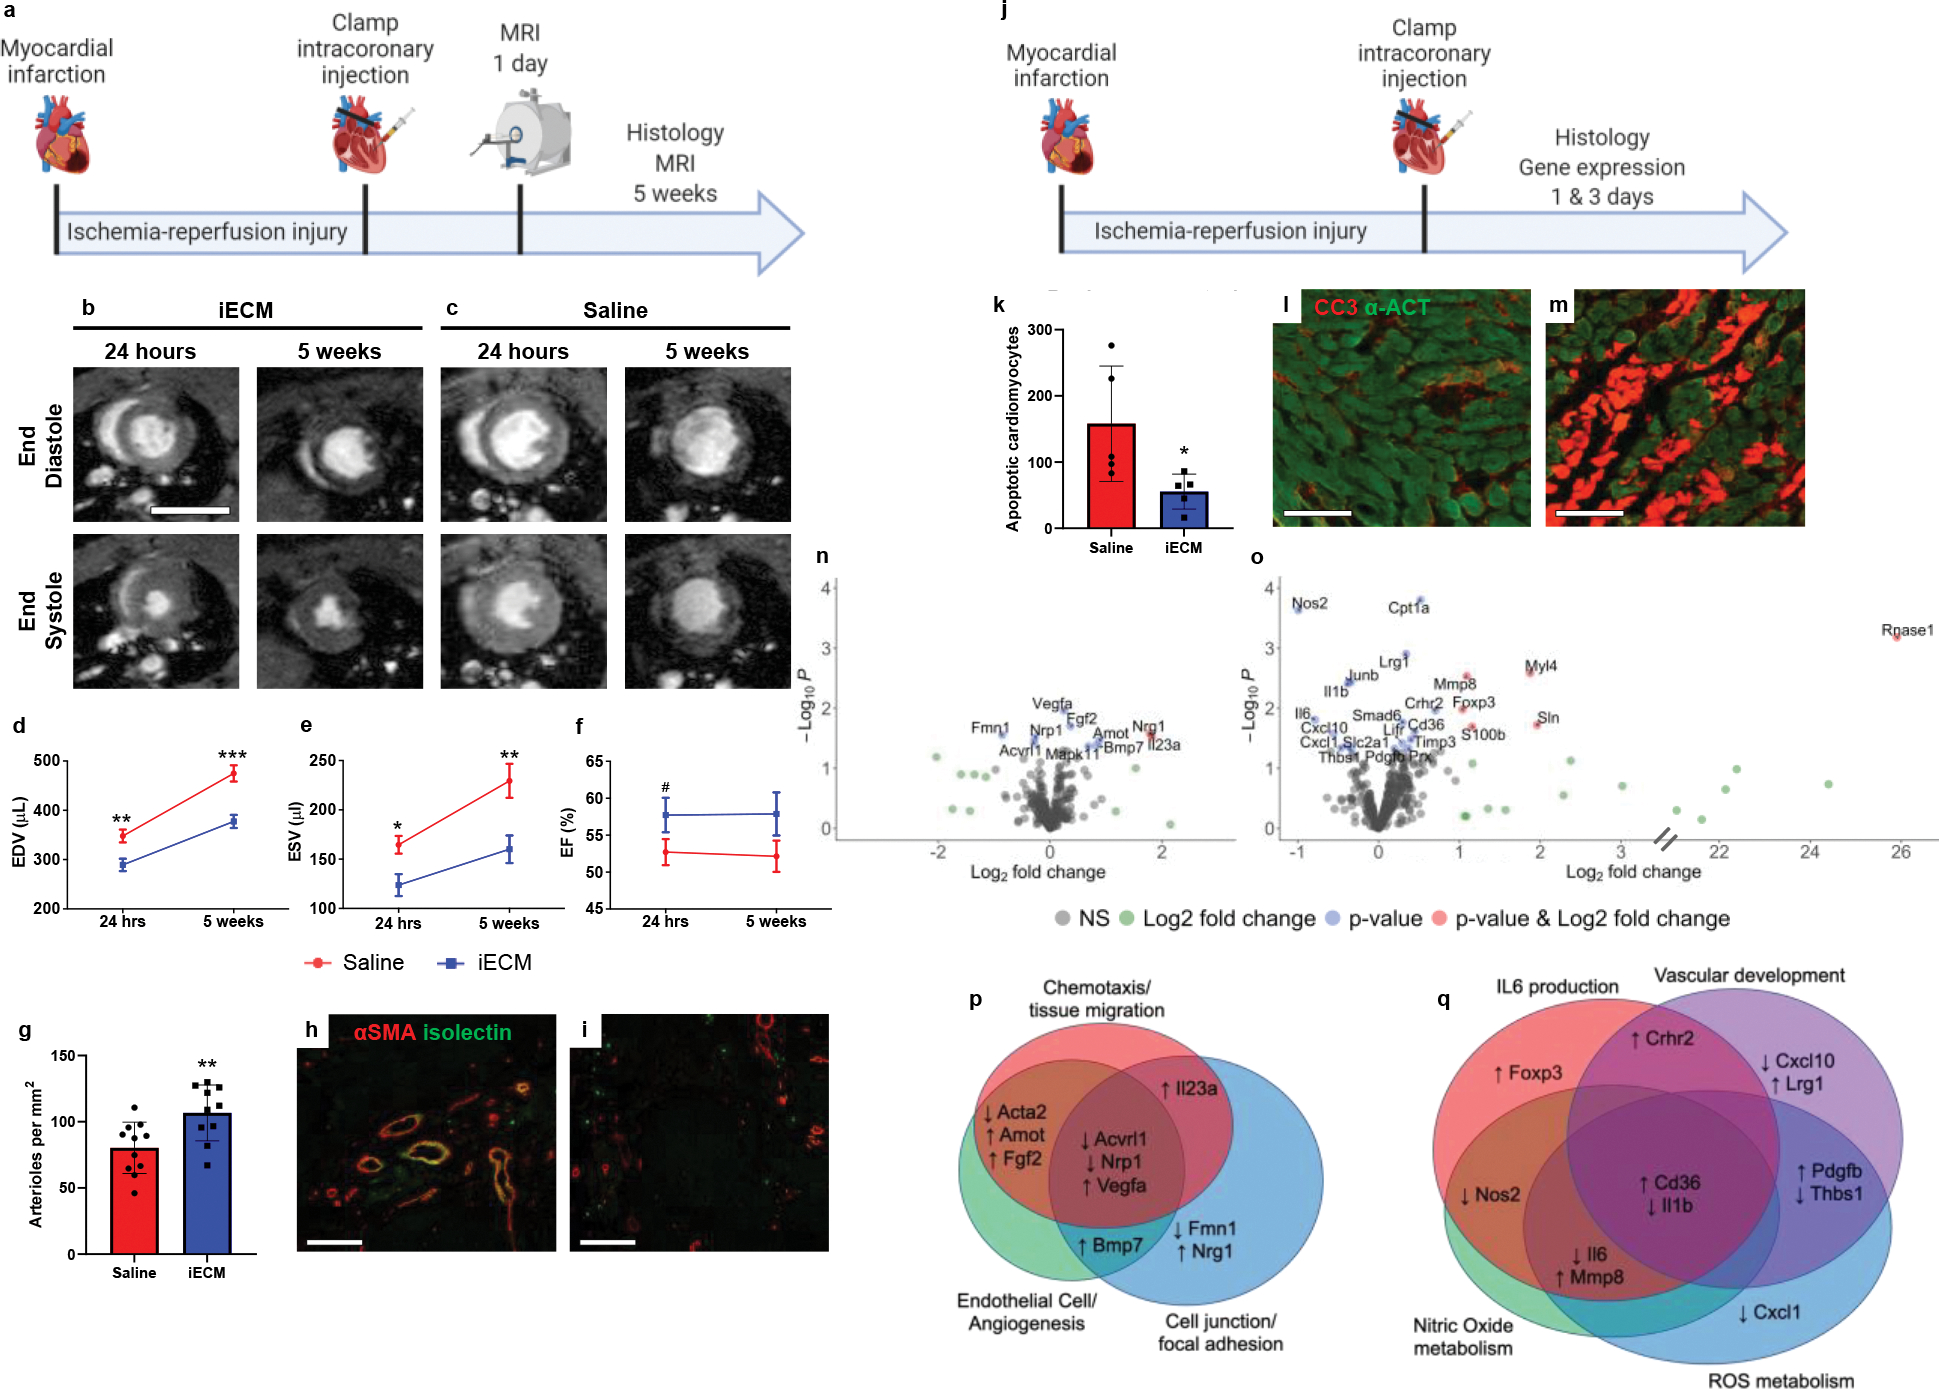
Figure 5:

Infusible extracellular matrix (iECM) significantly improved cardiac function post-MI. a, Timeline of survival study. b-c, Representative magnetic resonance images at 24 hours and 5 weeks post-injection of iECM (b) or saline (c). Scale bar 10 mm. d-f, iECM infusions preserve left ventricle volumes at 24 hours and 5 weeks post-MI, end diastolic volume (d, EDV, n=11 saline, n=10 at 24 hrs and n=11 at 5 weeks iECM, **p=0.005 at 24 hrs, ***p<0.001 at 5 weeks), end systolic volume (e, ESV, n=11 saline, n=10 at 24 hrs and n=11 at 5 weeks iECM, *p=0.01 at 24 hrs, **p=0.006 at 5 weeks), ejection fraction (f, EF, n=11 saline, n=10 at 24 hrs and n=11 at 5 weeks iECM, #p=0.1 at 24 hrs). g, Infarct arteriole density increased with iECM infusions at 5 weeks post-infusion (n=11 saline, n=10 iECM, **p=0.008), promoting neovascularization. Representative images of iECM (h) and saline (i) infused hearts, alpha smooth muscle actin (αSMA) in red for arterioles and isolectin in green for endothelial cells. Scale bar 250 μm. j, Timeline of acute mechanisms of repair study. Mechanisms of repair were evaluated through histology (k-m) and gene expression (n-q) analyses. k, Number of cardiomyocytes undergoing apoptosis significantly decreased in the border zone of iECM infused hearts at 3 days post-infusion (n=5 saline, n=5 iECM, *p=0.04). Representative images of iECM (l) and saline (m) infused hearts, cleaved caspase 3 (CC3) for apoptosis in red, and alpha actinin (α-ACT) for cardiomyocytes in green. Scale bar 100 μm. Volcano plots showing differential gene expression from NanoString analysis at 1 day (n) and 3 days (o) after iECM infusion. Genes related to chemotaxis/tissue migration, endothelial cells/angiogenesis, and cell junction/focal adhesion proteins are differentially expressed 1 day (p) following iECM infusions and genes related to Interleukin 6 (IL6), vascular development, nitric oxide metabolism, and reactive oxygen species (ROS) metabolism are differentially expressed at 3 days (q) following infusion. Data are mean ± SEM. All data are biological replicates. Data in d-f, g, and k were evaluated with a two tailed unpaired t-test. a,j created with Biorender.com.
