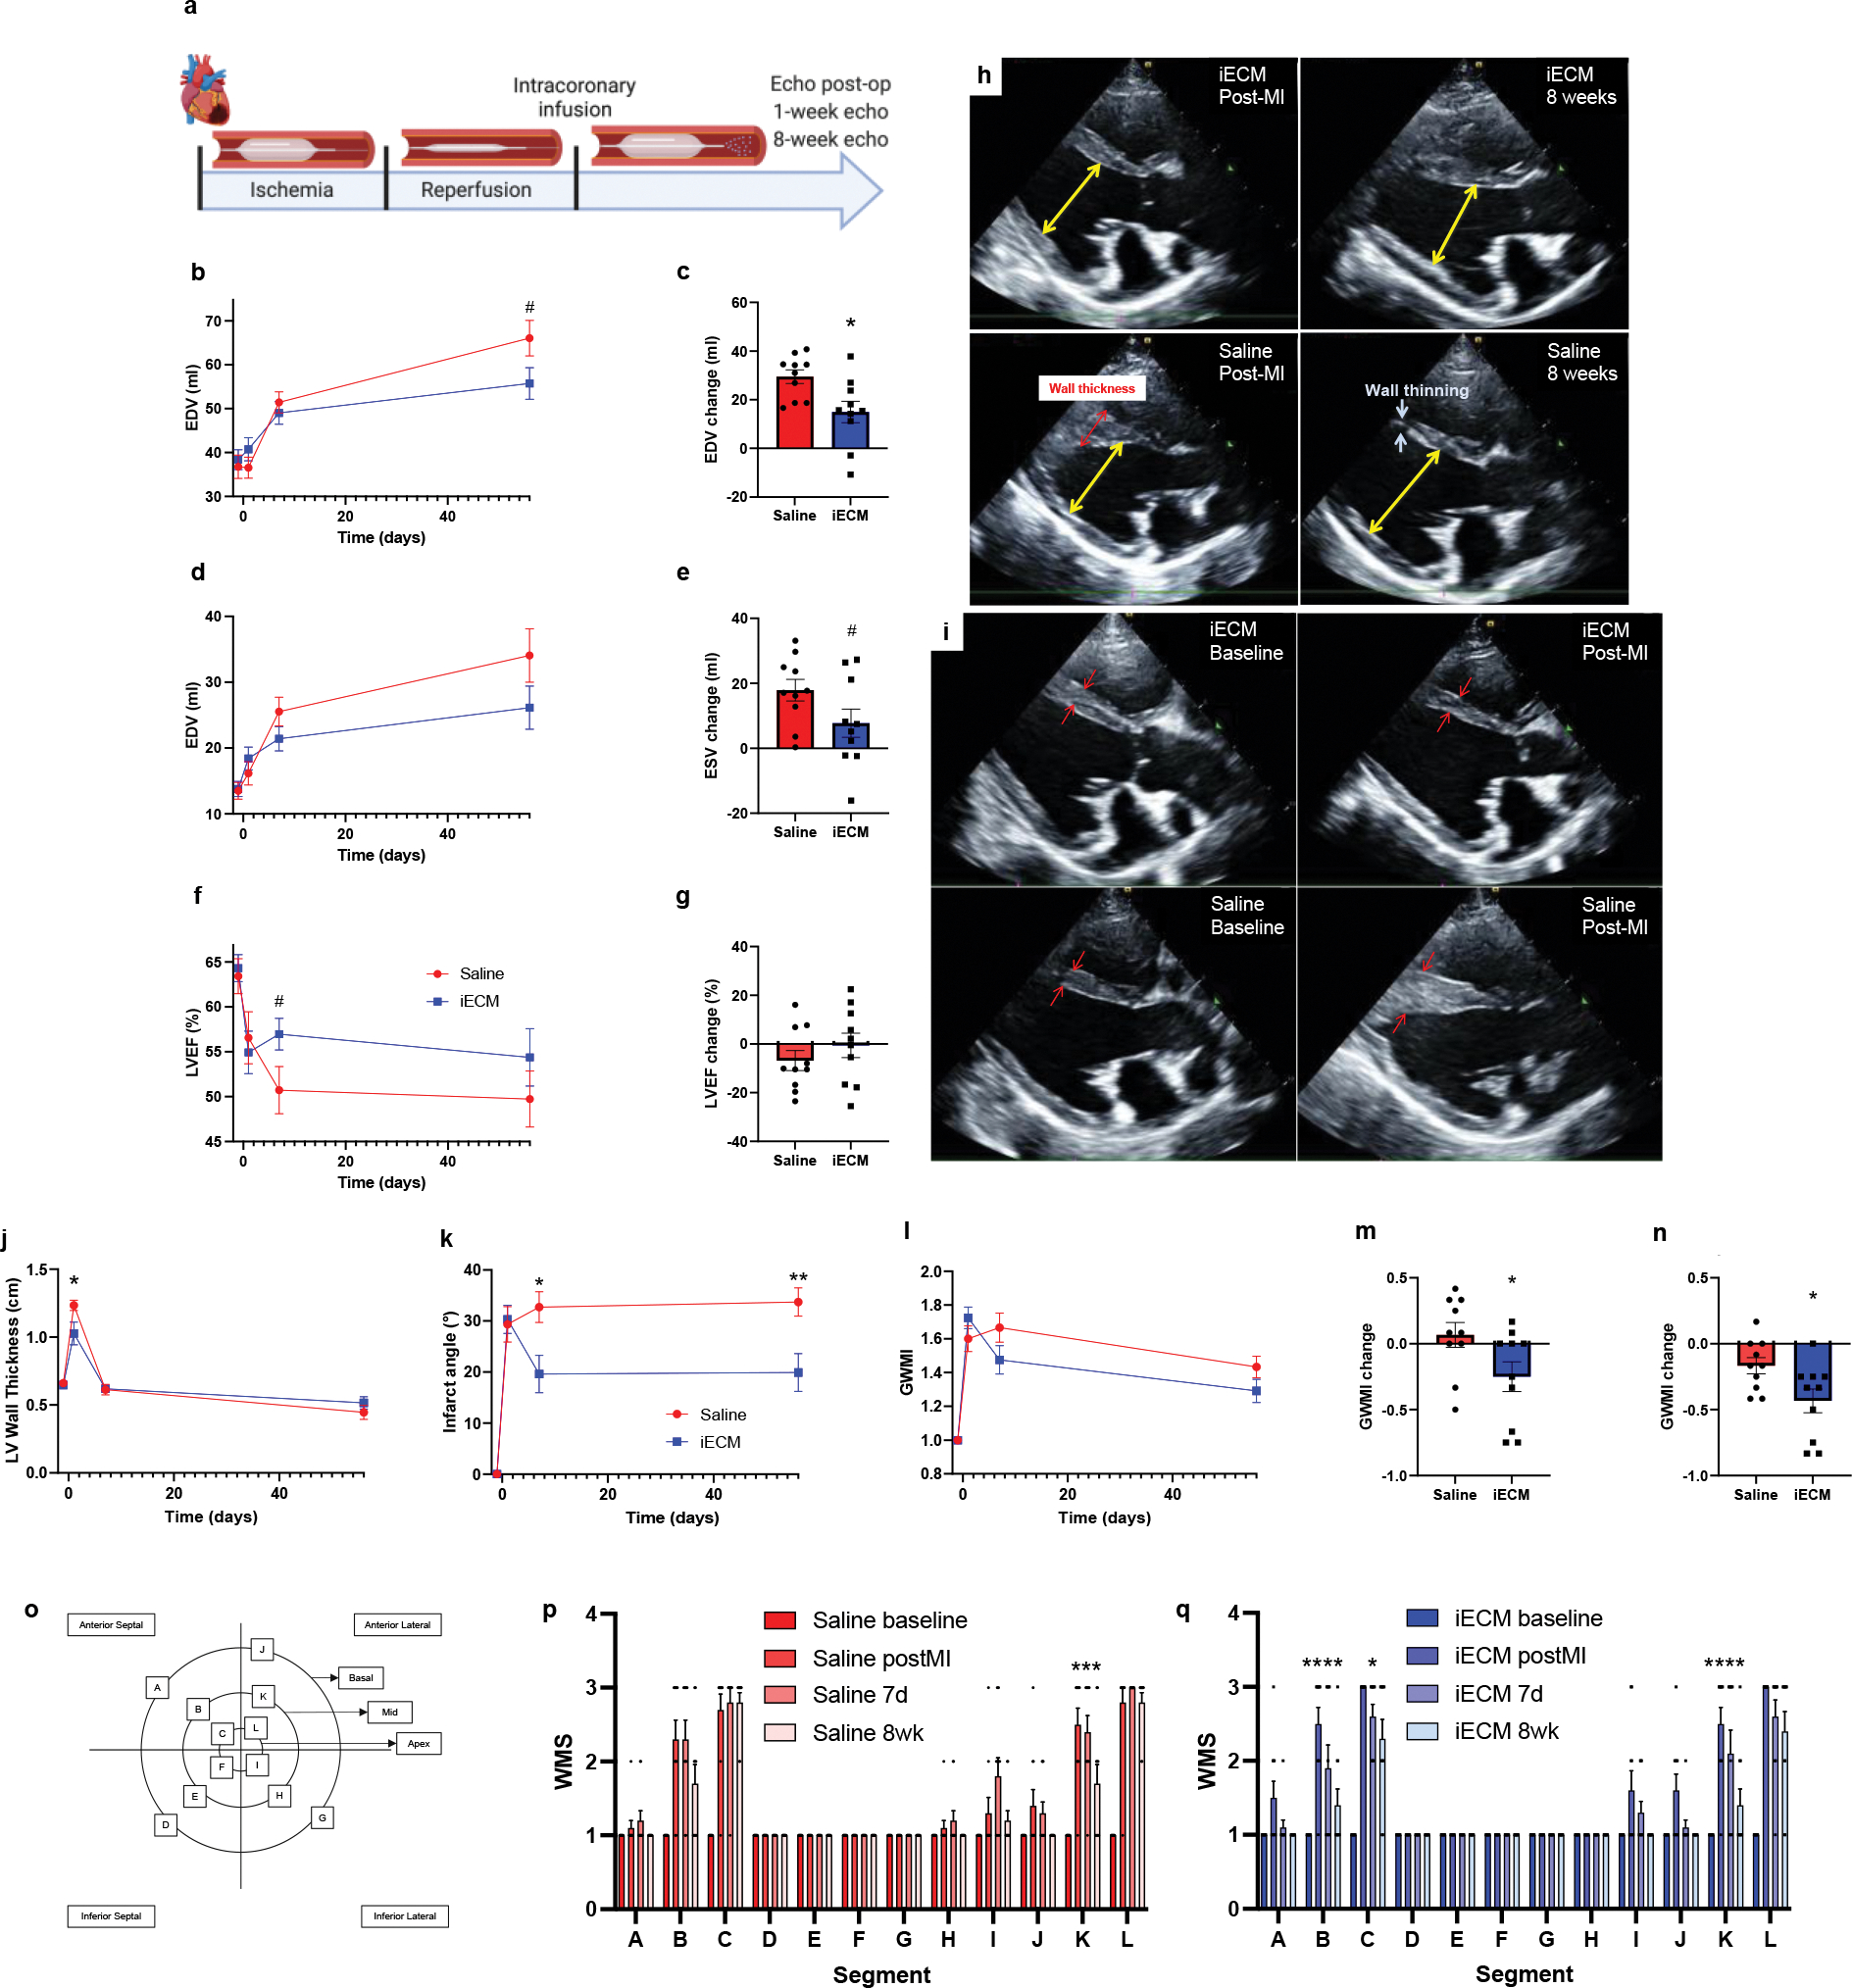
Figure 7:

iECM infusions mitigate negative left ventricular remodeling in pig acute MI model. a, Timeline of survival study following induced MI and iECM or saline infusion. End diastolic volume (EDV), end systolic volume (ESV), ejection fraction (EF), left ventricular (LV) wall thickness, infarct angle, global wall motion index (GWMI), and wall motion scores (WMS) were measured before MI (baseline), post-MI, 7 days, and 8 weeks post-MI (n=10 all groups). B-g, Changes in EDV, ESV, and EF over time (b,d,f) and at 8 weeks post post-MI relative to immediately post-MI (c,e,g), suggest iECM infusions mitigate negative left ventricular remodeling (b: #p=0.07, c: *p=0.01, e: #p=0.08 compared to saline). Representative echocardiography images at end diastole show how iECM infusions mitigate negative LV remodeling from post-MI to 8 weeks post-MI (h) and mitigate acute increases in wall thickness post-MI (i). Red arrows indicate wall thickness, yellow arrows are used for LV end diastolic measurement. Changes in MI wall thickness (j, *p=0.04), infarct angle (k, *p=0.01, **p=0.008), GWMI (l-n; m: *p=0.045, n: *p=0.03 ), and WMS segments (o-q) over time, showing how iECM infusions preserve LV wall thickness and motion and mitigate infarct expansion. o, Wall motion score diagram used for scoring wall motion. p, Saline wall motion scores (Segment K: ***p<0.001 post-MI vs. 8 weeks). q, iECM wall motion scores (Segments B and K: ****p<0.0001, Segment C: *p=0.01 post-MI vs. 8 weeks). Data are mean ± SEM. All data are biological replicates. Data in b-n were evaluated with a two tailed unpaired t-test. Data in p and q were evaluated with one way ANOVA with Tukey post-hoc test. a created with Biorender.com.
