Figure 2.
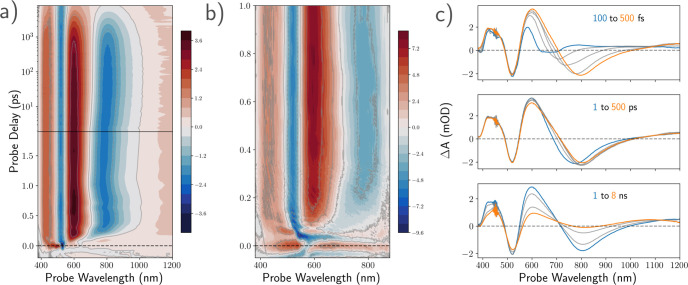
Photoinduced dynamics of DNA-Ag16NC in 10 mM ammonium acetate solution. (a) Wavelength vs probe-delay map of the WL-TA experiment after excitation at 520 nm. The total time range is 8 ns. Note the change from linear to logarithmic scale at 1.8 ps (solid line). (b) HCF-TA experiment showing the spectral dynamics over the first picosecond after excitation centered at 580 nm. (c) Transient spectra extracted from panel a over several time ranges of interest. Spectra shown at probe delays: top panel, 100 (blue), 150, 200, 300, 500 (orange) fs; middle panel, 1 (blue), 5, 50, 100, 500 (orange) ps; bottom panel, 1 (blue), 2, 5, 8 (orange) ns.

