Figure 4.
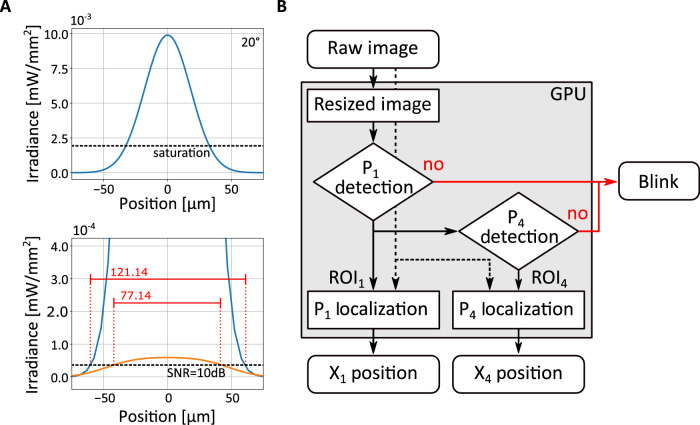
A tracking algorithm emulating the analog DPI. (A) Characteristics of Purkinje images. Data are obtained from the model in Figure 3, using a collimated 10 mm beam provided by a 2 mW source at 20° on both axes. Exposure time was set to 1 ms. The top panel shows the profile of P1 before clipping intensity at the saturation level. The bottom panel shows both P1 (with saturated intensity; blue curve) and P4 (orange curve). The red horizontal bars represent the diameters of the reflections exceeding 10 dB. (B) Flowchart of the tracking algorithm. A low-resolution image of the eye (solid line) is first used to detect P1 and P4 and determine their approximate locations. Failure in detecting one of the two reflections is labeled as blink. High-resolution localization of the Purkinje images (dashed lines) is then obtained from selected regions of interest (ROI1 and ROI4).

