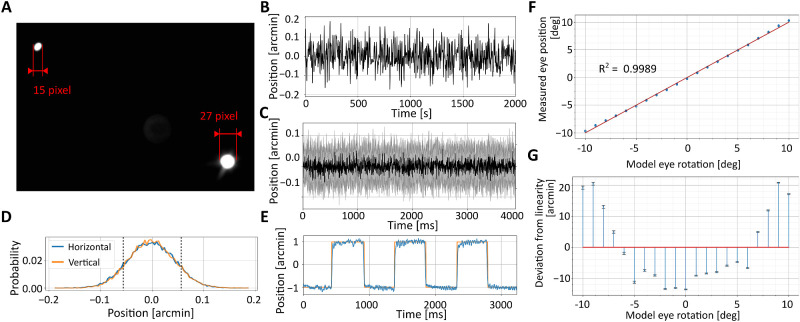
Figure 6.
Performance with artificial eyes. (A) Example of Purkinje images acquired at a 1-kHz sampling rate. (B–E) dDPI resolution. (B) An example trace with a stationary artificial eye. (C) Average dDPI output (black line) ± 1 standard deviation (shaded region; N = 30) measured with a stationary eye. (D) The resulting output distributions on both horizontal and vertical axes. Dashed lines represent 1 standard deviation. (E) Measurements obtained when the eye moves following a 1′-amplitude square wave at 1 Hz. The orange line represents the ground truth, as measured by the encoders of the galvanometer controlling the eye. (F, G) dDPI linearity. (F) Output measured when the artificial eye was rotated over a 20° range. The red line is the linear regression of the data. (G) Deviation from linearity in the measured eye position.

