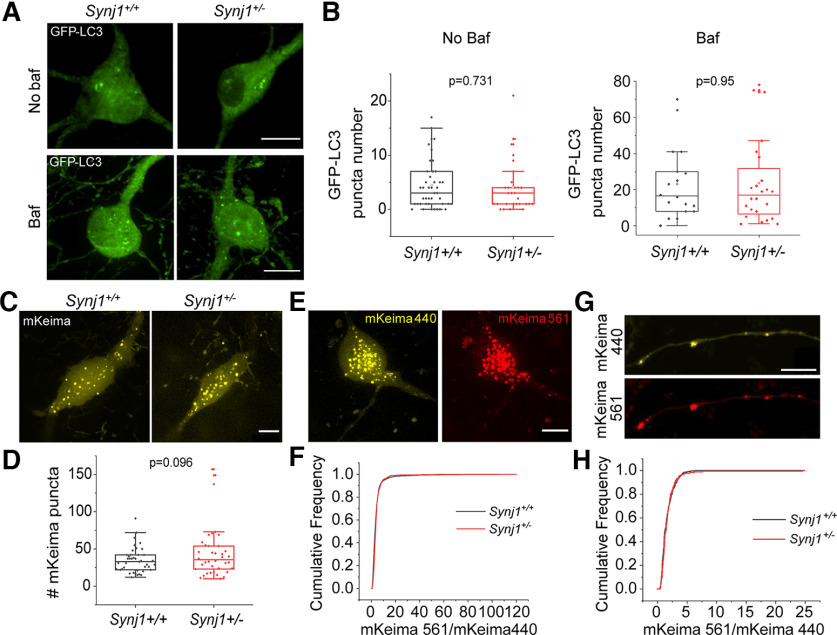
Figure 1.
Synj1 deficiency does not substantially alter baseline autophagosome formation and flux in cultured MB neurons. A, B, GFP-LC3-labeled autophagosome in the soma of Synj1+/+ and Synj1+/− MB neurons treated with/without 25 nm bafilomycin A1 for 6 h. A, Representative images. B, Quantification for the GFP-LC3 numbers at the soma. For no baf group, N = 44/29 (Synj1+/+/Synj1+/−) neurons, for baf group, N = 18/24 (Synj1+/+/Synj1+/−) neurons. C, D, mKeima-labeled autophagosome in the soma of Synj1+/+ and Synj1+/− MB neurons. C, Representative images. D, Quantification for the mKeima puncta numbers at the soma, N = 41/38 (Synj1+/+/Synj1+/−) neurons. E, Representative images show mKeima signal in the soma of MB neuron following activation by 440- and 561-nm light. F, Distribution analysis of the ratio (mKeima561/mKeima440) for the mKeima puncta between Synj1+/+ and Synj1+/− MB neurons, N = 2355/899 (Synj1+/+/Synj1+/−) puncta. G, Representative images show mKeima signal in the axon of MB neuron from activation by 440 and 561 nm. H, Distribution analysis of the ratio (mKeima561/mKeima440) for the mKeima puncta between Synj1+/+ and Synj1+/− MB axons, N = 297/177 (Synj1+/+/Synj1+/−) puncta. The p values are from Student’s t test. Scale bar in all images: 10 μm.

