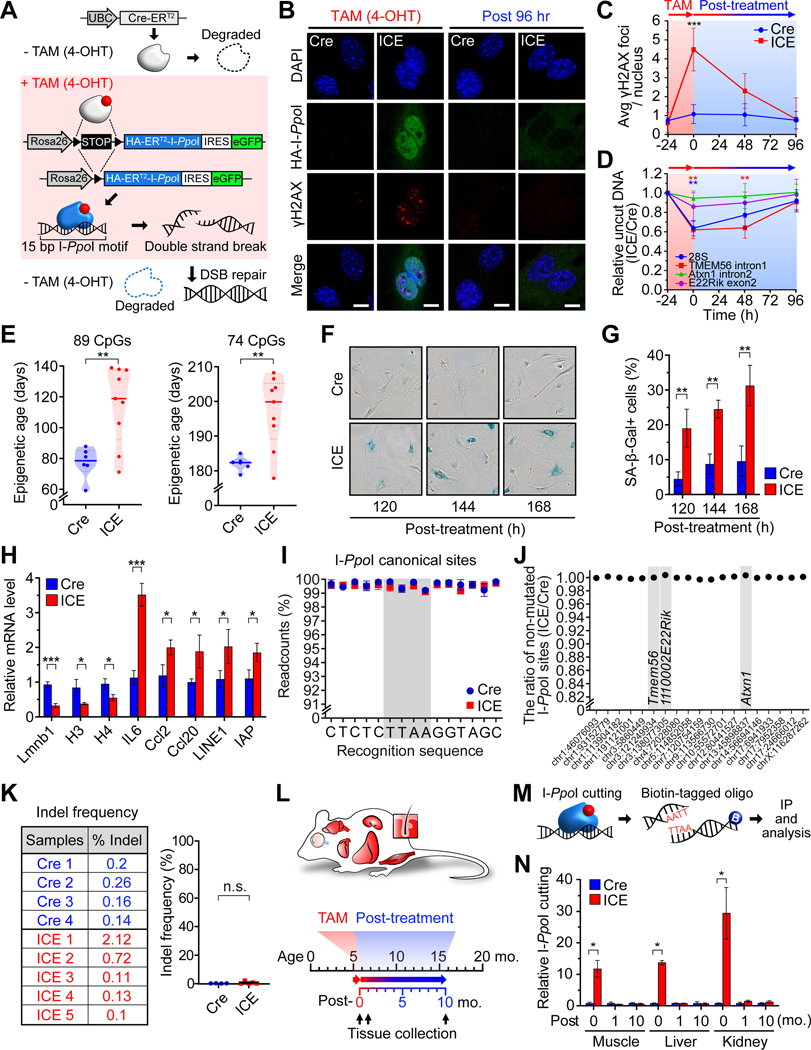
Figure 1. The Inducible Changes to the Epigenome (ICE) system.
(A) The ICE system with a TAM-inducible I-PpoI endonuclease.
(B and C) γH2AX foci in DAPI-stained nuclei of MEFs after TAM (4-OHT, 0.5 μM) treatment. Scale, 10 μm. Two-way ANOVA-Bonferroni.
(D) qPCR analysis of cutting at I-PpoI canonical sites. One-way ANOVA-Bonferroni.
(E) Epigenetic age of 96-hour post-treated ICE cells. All clock DNAme sites (left) and clock DNAme sites post-batch effect correction (right). Two-tailed Student’s t test.
(F and G) Senescence-associated β-galactosidase (SA-β-Gal) staining of post-treated cells. Two-tailed Student’s t test.
(H) mRNA levels of genes known to change during senescence 144 hours post-treatment. Two-tailed Student’s t test.
(I and J) Non-mutated I-PpoI canonical sequences in 96-hour post-treated cells assessed by deep sequencing (>50x).
(K) Mutation frequency of 28S rDNA in 96-hour post-treated cells. Two-tailed Student’s t test.
(L) Experimental design.
(M and N) Immunoprecipitation and quantification of a I-PpoI cut site (Tmem56) in skeletal muscle, liver and kidney during and after TAM treatment (0-,1- and 10-month post-treatment). Two-tailed Student’s t test.
Data are mean (n≥3) ± SD or ± SEM (N). n.s.: p > 0.05; *p < 0.05; **p < 0.01; ***p< 0.001.

