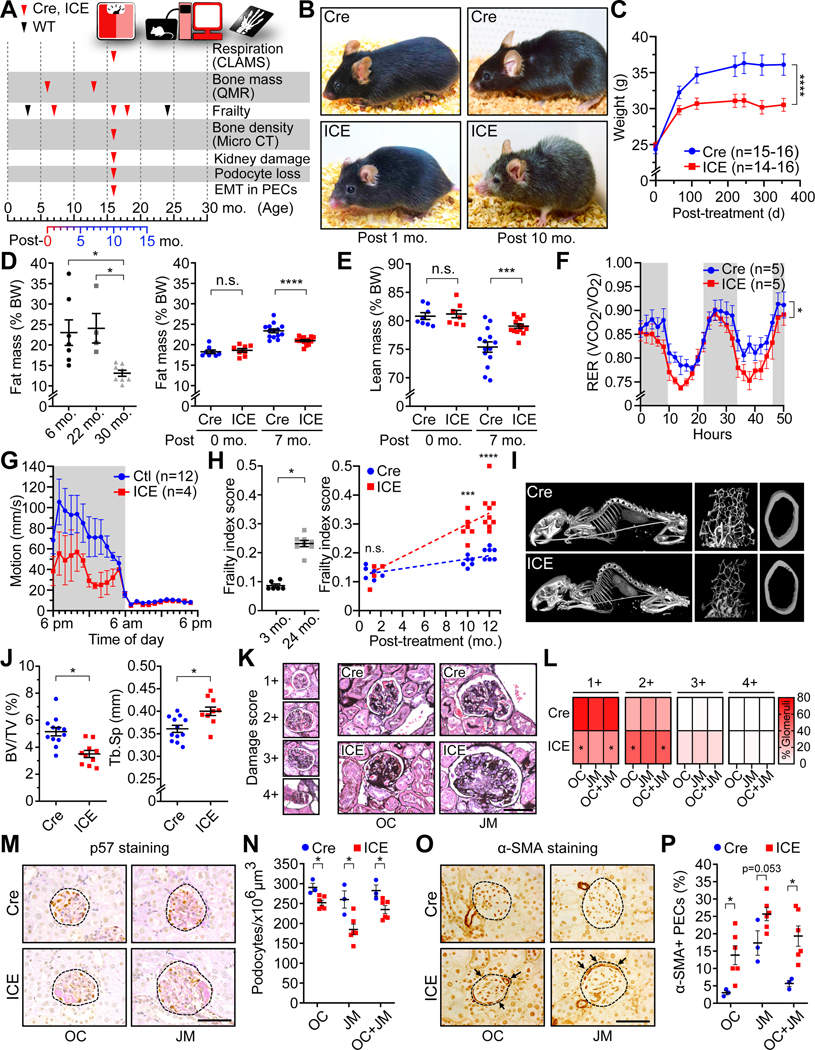
Figure 2. ICE mice phenocopy normal aging.
(A) Experimental design.
(B) Images of Cre and ICE mice.
(C-E) Weight and body mass. Two-way ANOVA-Bonferroni (C). One-way ANOVA-Bonferroni (D, left). Two-way ANOVA-Bonferroni (D right and E).
(F) Respiratory Exchange Rate (RER) of 10-month post-treated mice. Repeated measures two-way ANOVA-Bonferroni.
(G) Average motion over 24 hours.
(H) Frailty indices of Cre, ICE, WT 3- and 24-month-old mice. Two-tailed Student’s t test (left) or two-way ANOVA-Bonferroni (right).
(I and J) CT of whole skeleton and micro-CT of trabecular and cortical bones. Kyphosis assessment (I), bone/tissue volume (J, left) and trabecular separation (J, right). Two-tailed Student’s t test.
(K and L) Average damage scores (1+ normal – 4+ global scarring) of glomeruli of 10-month post-treated ICE mice. OC, outer cortex; JM, juxtamedullary glomeruli. Two- tailed Student’s t test.
(M and N) p57 (podocyte) and Periodic acid-Schiff staining, and podocyte density of 10-month post-treated ICE mice. Circles with broken line indicate glomeruli. Scale bar, 50 μm. Two-tailed Student’s t test.
(O and P) Fraction of α-SMA-positive cells in parietal epithelial cells (PEC) along Bowman’s capsule (arrows) of 10-month post-treated ICE mice showing an epithelial to mesenchymal transition (EMT). Circles with broken line indicate glomeruli. Scale bar, 50 μm. Two-tailed Student’s t test.
Data are mean ± SEM. n.s.: p > 0.05; *p < 0.05; ***p< 0.001; ****p< 0.0001.

