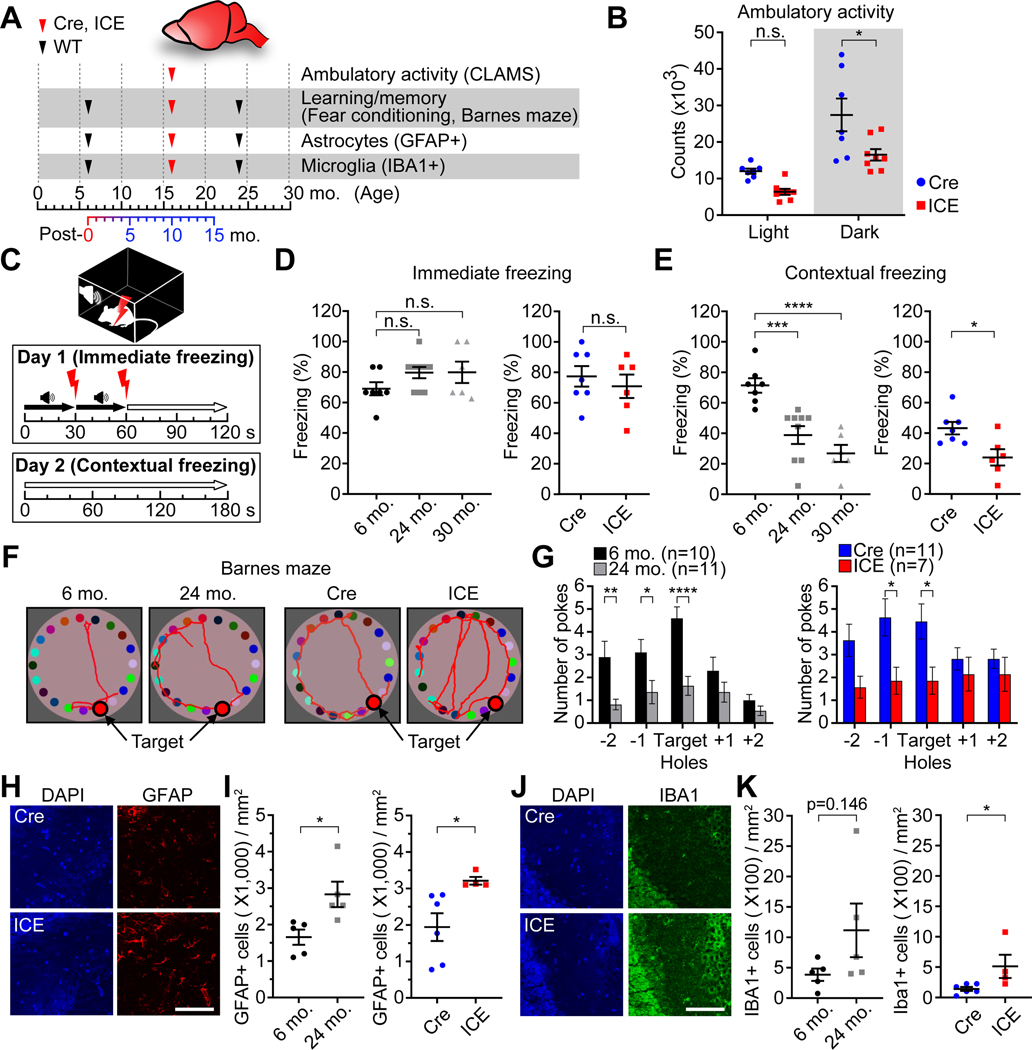
Figure 3. ICE mice phenocopy brain aging.
(A) Experimental design.
(B) Ambulatory activity of 10-month post-treated mice in light and dark cycles. Two-way ANOVA-Bonferroni.
(C-E) Immediate and contextual freezing in fear conditioning tests in 10-month post-treated mice. One-way ANOVA-Bonferroni (D, left and E, left) or two-tailed Student’s t test (D, right and E, right).
(F and G) Representative images of Barnes maze tests and mean number of pokes at each hole in 10-month post-treated mice. Two-way ANOVA-Bonferroni.
(H-K) Immunofluorescence of the hippocampal CA3 region stained for astrocyte activation (GFAP) and microglia (IBA1) in 10-month post-treated mice. Scale bar, 100 μm. Two-tailed Student’s t test.
Data are mean ± SEM. n.s.: p > 0.05; *p < 0.05; **p < 0.01; ***p< 0.001; **** p < 0.0001.

