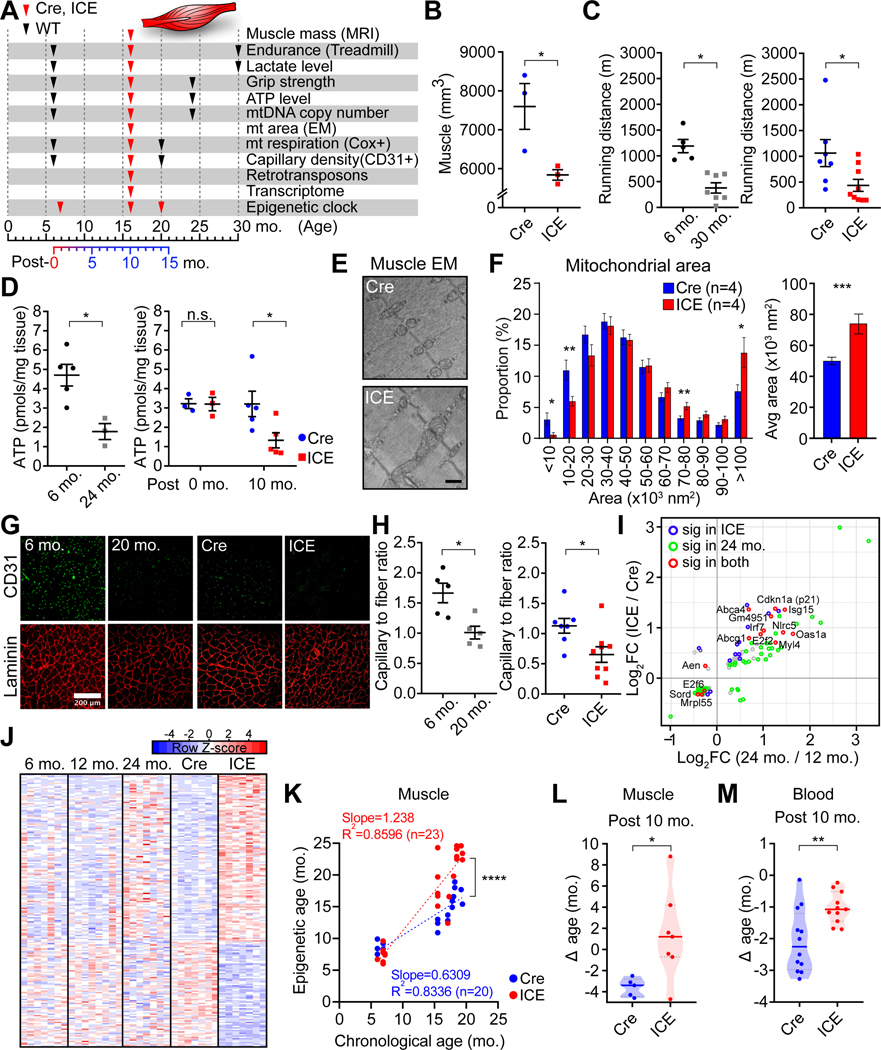
Figure 4. ICE mice phenocopy muscle aging.
(A) Timeline of phenotypic assessments of mice.
(B) Muscle mass of 10-month post-treated mice assessed by MRI. Two-tailed Student’s t test.
(C) Treadmill endurance in WT, 10-month post-treated mice. Two-tailed Student’s t test.
(D) ATP levels in 10-month post-treated muscle. Two-tailed Student’s t test (let) or two-way ANOVA-Bonferroni (right).
(E and F) Mitochondrial morphology and area of 10-month post-treated muscle. Scale bar, 500 nm. Two-tailed Student’s t test.
(G and H) 10-month post-treated gastrocnemius. Laminin (red) and CD31(green), marking extracellular matrix and capillaries, respectively. Two-tailed Student’s t test.
(I) Scatter plot of genes changed (p < 0.01) in muscle from 10-month post-treated ICE and WT 24-month-old mice with significantly changed genes (padj < 0.05) in color.
(J) Heatmaps of the top 200 most significantly altered genes in skeletal muscle.
(K) Epigenetic age of gastrocnemii 1-, 10-, and 14-month post-treatment. Linear regression analysis.
(L and M) Epigenetic age of muscle and blood 10-month post-treatment (Δ age = epigenetic age – chronological age). Two-tailed Student’s t test.
Data are mean ± SEM. n.s.: p > 0.05; *p < 0.05; **p < 0.01; ***p< 0.001; **** p < 0.0001.

