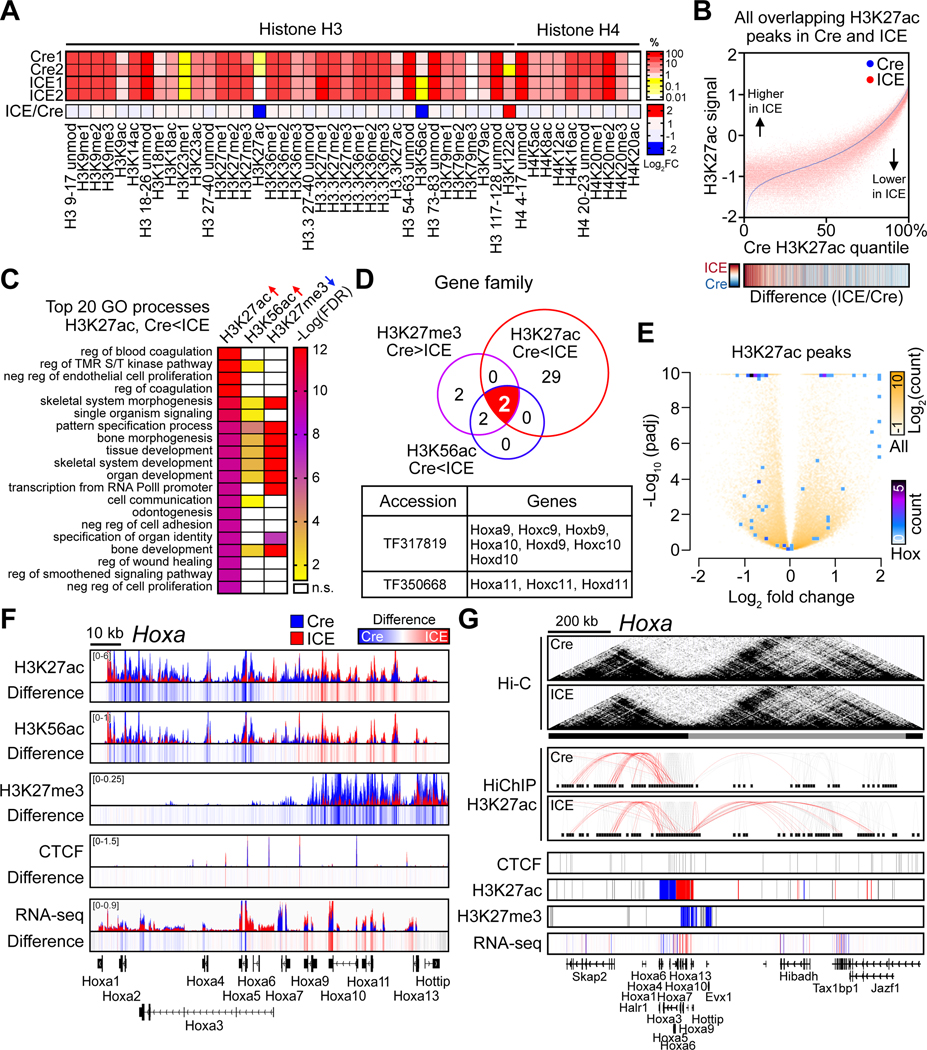
Figure 5. Erosion of the epigenetic landscape in ICE cells.
(A) Quantitative mass spectrometry of histone H3 and H4 modifications in 96-hour post-treated ICE cells. %, relative abundance; unmod, unmodified; me, methylation; ac, acetylation.
(B) Genome-wide changes of H3K27ac in 96-hr post-treated cells. Heatmap of ICE/Cre.
(C) Gene Ontology analysis of H3K27ac-increased, H3K56ac-increased, or H3K27me3-decreased peaks ordered by top 20 processes enriched in H3K27ac-increased regions (padj < 0.01). ↑, Cre < ICE peaks, padj < 0.01; ↓, Cre > ICE peaks, padj < 0.01.
(D) TreeFam analysis of gene families with overlapping regions with histone modification changes (padj < 0.01) in ICE cells.
(E) Volcano plot of H3K27ac peaks. All peaks and peaks in Hox genes shown white to yellow and blue to purple, respectively.
(F) ChIP-seq track of histone modifications and mRNA levels across the 120 kb Hoxa locus of post-treated ICE cells. Difference = ICE – Cre
(G) Hi-C contact matrices and HiChIP contact loops in Hoxa. Red, chromatin contacts between Hoxa promoters and other regions. Lower panels, regions with ChIP-seq or RNA-seq peaks. Peak regions, red (Cre<ICE), blue (Cre>ICE) or grey (unchanged).

