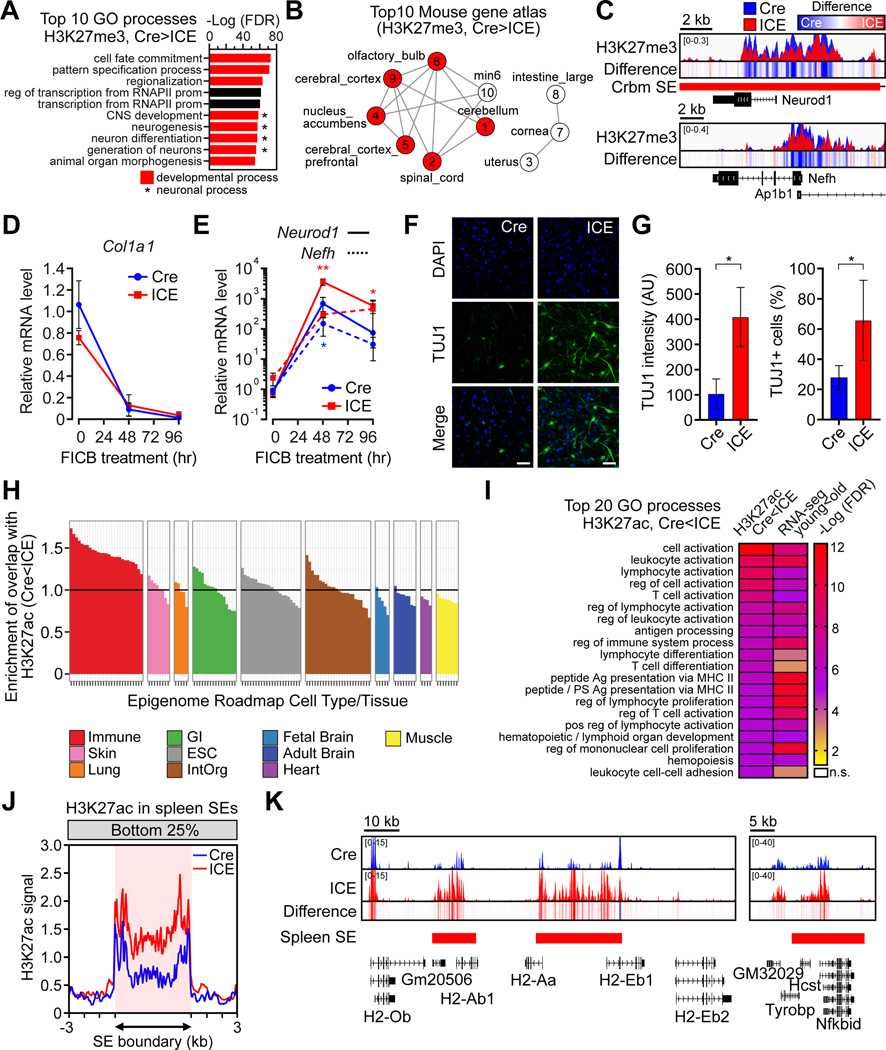
Figure 6. Induction of the ICE system disrupts cellular identity.
(A) Gene Ontology analysis of H3K27me3 decreased regions (padj < 0.05). Red, developmental processes. *Neuronal processes.
(B) Mouse tissue types of transcriptional profiles that overlap decreased H3K27me3 regions (padj < 0.05) in ICE cells. Red, neuronal tissues. Numbers indicate rank.
(C) ChIP-seq track of neuronal markers, Neurod1 and Nefh. Difference = ICE – Cre. (D and E) Time-course of mRNA levels of Col1A1 (a fibroblast marker), Neurod1 and Nefh (neuronal markers) during neuronal reprogramming. Two-way ANOVA-Bonferroni. (F and G) Neuronal marker TUJ1 8 d after reprogramming. DNA stained with DAPI. Scale bar, 100 μm. Two-tailed Student’s t test.
(H) Comparison of H3K27ac increased regions (p < 0.01) to epigenome roadmap data from different human tissue types.
(I) Gene Ontology comparison of H3K27ac increased regions in 10-month post-treated ICE mice (16 mo.) (p < 0.01) to RNA-seq data from skeletal muscle from old WT mice (24 mo.) (padj < 0.05).
(J) Aggregation plots of H3K27ac signal in bottom 25% quantile in spleen super-enhancer regions.
(K) H3K27ac ChIP-seq tracks across spleen super-enhancers in the class II major MHC cluster and Nfkbid in 10-month post-treated muscle.
Data are mean (n≥3) ± SD. *p < 0.05; **p < 0.01.

