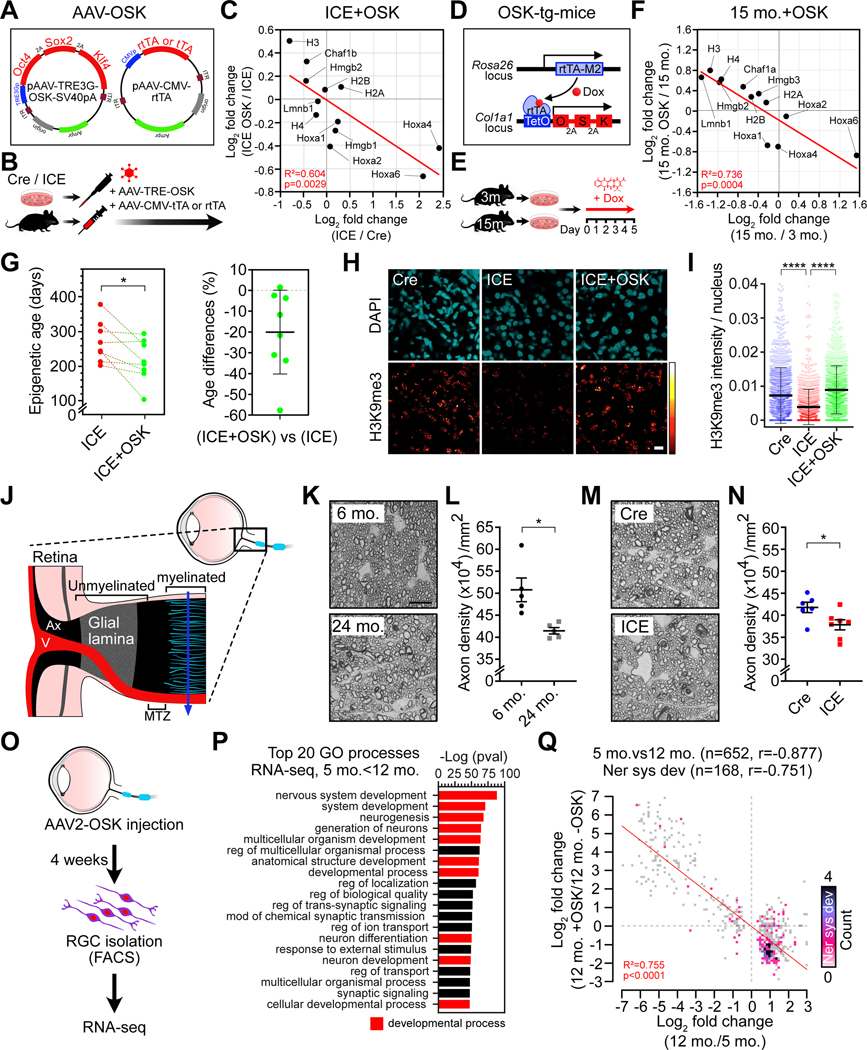
Figure 7. Epigenetic reprogramming restores youthful epigenetic marks.
(A) AAV vectors used for polycistronic OSK expression.
(B) Experimental scheme for AAV-OSK transduction to post-treated ICE cells and mice.
(C) Scatter plot of mRNA changes in ICE (AAV-DJ-rtTA, n=3) and ICE+OSK (AAV-DJ- rtTA and OSK, n=3) fibroblasts from 1-month post-treated ICE mice. Linear regression.
(D) Transgenes in the OSK transgenic mouse.
(E) OSK induction in fibroblasts from young (3 mo., n=8) or old (15 mo., n=3) OSK transgenic mice by Dox treatment.
(F) Scatter plot of mRNA changes by aging or OSK. Linear regression.
(G) Epigenetic age of post-treated ICE (AAV-DJ-tTA, n=8) and ICE+OSK (AAV-DJ-tTA and OSK, n=8) MEFs at 10-day post-AAV transduction. Two-tailed paired Student’s t test.
(H and I) H3K9me3 in Cre (AAV-MYO3-tTA, n=3), ICE (AAV-MYO3-tTA, n=2) and ICE+OSK (AAV-MYO3-tTA and OSK, n=4) kidney at 5-week post-AAV injection. One-way ANOVA-Bonferroni.
(J) Optic nerve head: section used for axon counts (solid blue line). V, retinal blood vessels; MTZ, myelination transition zone; Ax, axon bundles.
(K-N) Density of PPD-stained myelinated optic nerve axons. Scale bar, 10 μm. Two-tailed Student’s t test.
(O) Intravitreal injection of AAV2-OSK and RGC sorting. RGCs isolated by FACS from retinas of young (5 mo., n=5), old (12 mo., n=6) and old mice injected with AAV2-OSK (15 mo., n=4).
(P) Gene Ontology analysis of upregulated genes in RNA-seq data (5 mo. vs 12 mo., padj < 0.01).
(Q) Scatter plot of mRNA changes due to aging or epigenetic reprogramming in age-associated genes (grey) and nervous system development genes (other colors). Data are mean ± SD or ± SEM (L and N). *p < 0.05; **** p < 0.0001.

