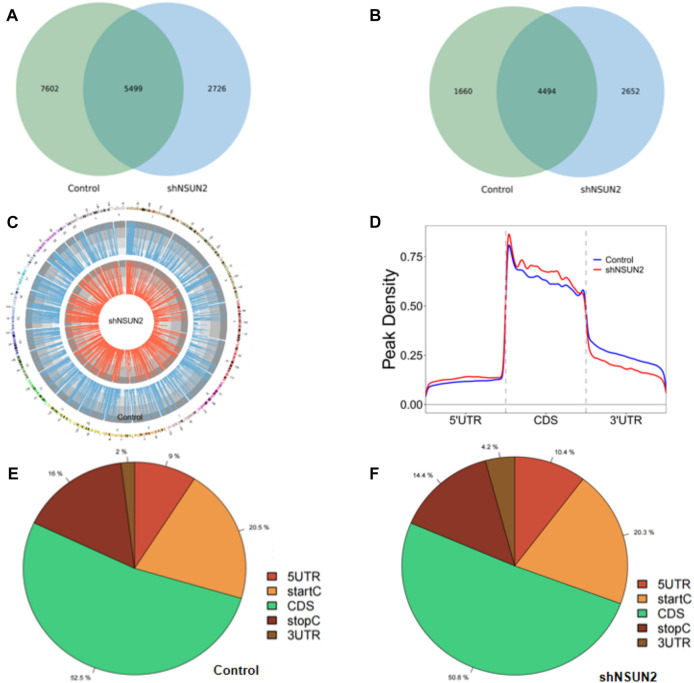
FIGURE 2.
Characteristics of m5C peaks in HCT15 cell and sh-NSUN2 HCT15 cell (A) Venn diagram of m5C peaks in HCT15 cell and sh-NSUN2 HCT15 cell. (B) Venn diagram of m5C genes in HCT15 cell and sh-NSUN2 HCT15 cell. (C) Visualization of m5C at the chromosome level in HCT15 cell and sh-NSUN2 HCT15 cell (D) Accumulation of the region of average m5C peaks along all transcripts in HCT15 cell and sh-NSUN2 HCT15 cell. (E,F) Pie chart of the source of methylated mRNA in HCT15 cell and sh-NSUN2 HCT15 cell.

