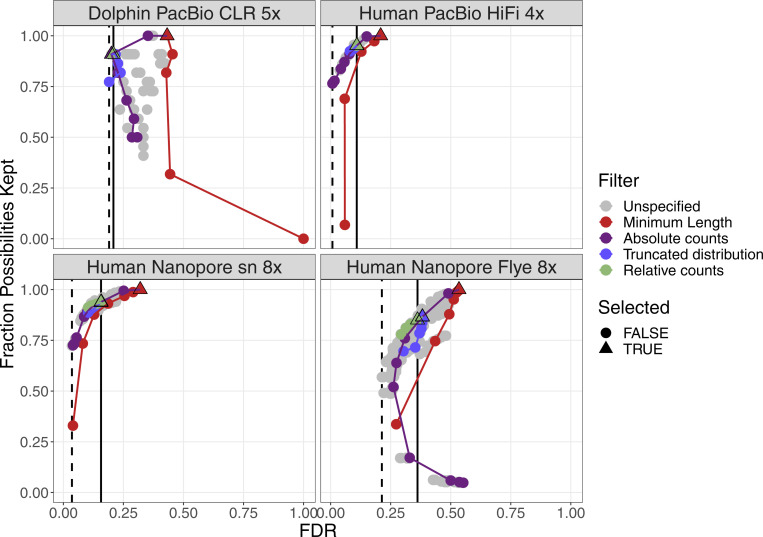
Figure S7. Filter performance for four datasets with very low coverage showing FDR and completeness.
The filters are ordered in the legend by their order of execution. The triangles mark the selected value for a given filter, which all subsequent filters use. The unspecified category is the possible combinations of filter values tested in a grid search for which the values of the previous filters were not selected. More details can be found in Figs S3–S6. The solid vertical line marks the FDR with default parameter, and the dashed vertical line marks the lowest FDR found in the grid search. The coloured lines connect the dots in order from least to most stringent for each filter.

