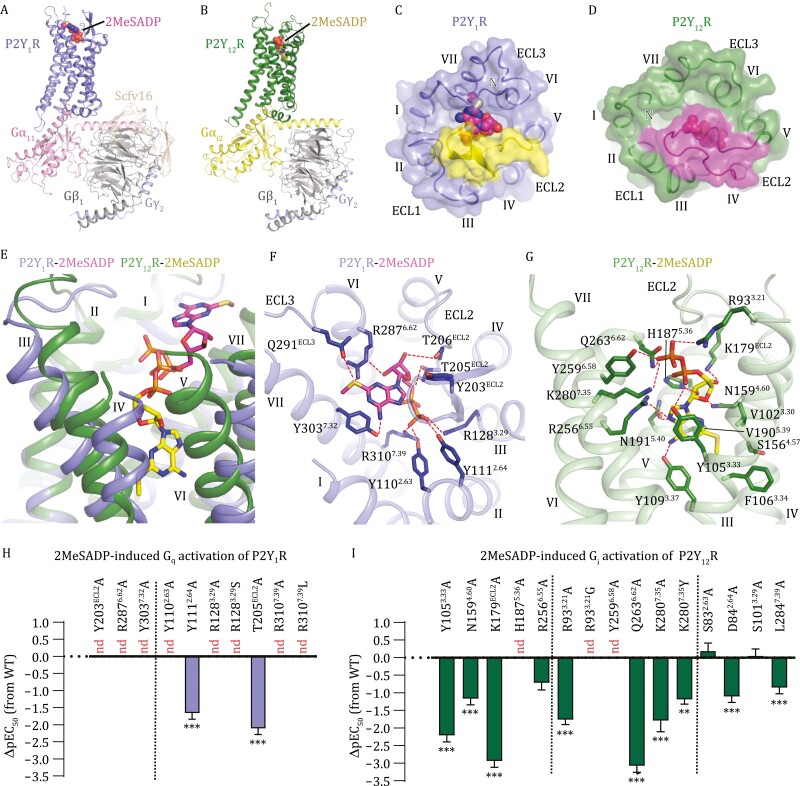
Figure 1.
Overall structures and ligand-binding modes of the 2MeSADP-P2Y 1 R-G 11 and 2MeSADP-P2Y 12 R-G i2 complexes. (A) Structure of the 2MeSADP-P2Y1R-G11 complex. The structure is shown in cartoon representation. The agonist 2MeSADP is shown as spheres. (B) Structure of the 2MeSADP-P2Y12R-Gi2 complex. The structure is shown in cartoon representation. The agonist 2MeSADP is shown as spheres. (C) Ligand-binding pocket in the 2MeSADP-P2Y1R-G11 complex. The receptor is shown in cartoon and surface representations in an extracellular view. ECL2 is colored yellow. 2MeSADP is shown as spheres. (D) Ligand-binding pocket in the 2MeSADP-P2Y12R-Gi2 complex. The receptor is shown in cartoon and surface representations in an extracellular view. ECL2 is colored magenta. 2MeSADP is shown as spheres. (E) Comparison of 2MeSADP binding poses at P2Y1R and P2Y12R. The agonist 2MeSADP is shown as sticks. The receptors are shown as cartoon. (F) Interactions between P2Y1R and 2MeSADP. The P2Y1R residues involved in interactions are shown as blue sticks. The polar interactions are displayed as red dashed lines. (G) Interactions between P2Y12R and 2MeSADP. The P2Y12R residues involved in interactions are shown as green sticks. The polar interactions are displayed as red dashed lines. (H and I) 2MeSADP-induced G-protein activation assays of P2Y1R (H) and P2Y12R (I). Bars represent differences in calculated 2MeSADP potency (pEC50) for each mutant relative to the wild-type receptor (WT). Data are shown as mean ± s.e.m. from at least three independent experiments performed in triplicate. nd, not determined. **P < 0.01, ***P < 0.001 (one-way ANOVA followed by Dunnett’s post-test, compared with the response of WT). See Table S2 for detailed statistical evaluation and expression levels.

