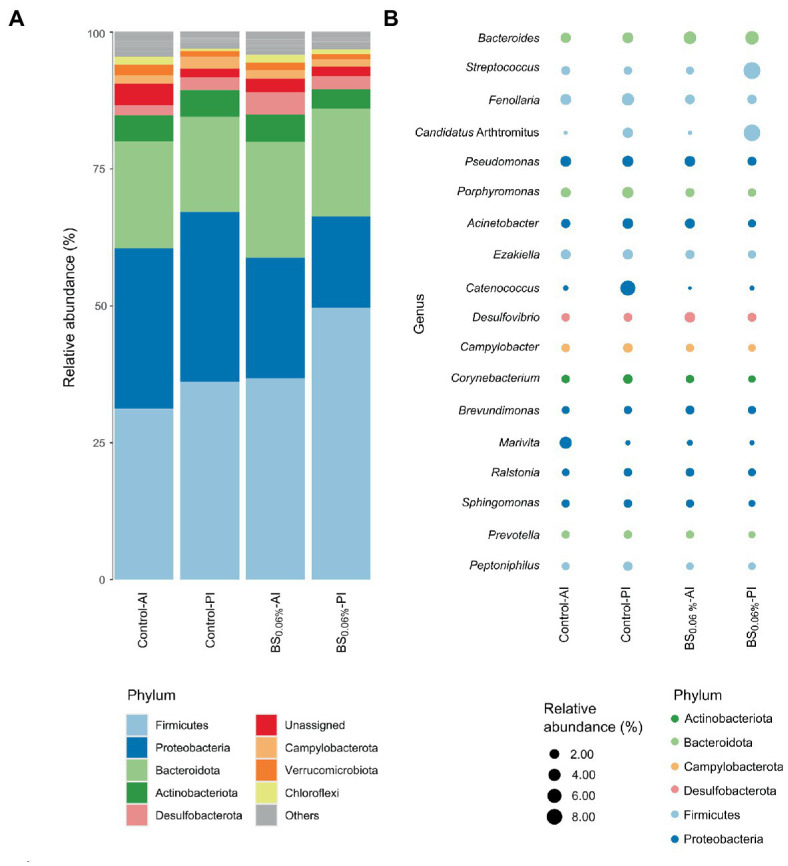
Figure 3.

Relative abundances of gut bacterial taxa from gilthead seabream (Sparus aurata). Data are expressed at phylum (A) and genus (B) levels (excluding unassigned genera). Taxa appearance in the figures is in order of decreasing abundance (from bottom to top in the bar graph, and inversely in the bubble plot). Taxa with an abundance < 1% are classified as others in the bar graph and not represented in the bubble plot. Experimental groups (n = 12 fish per group): anterior (Control-AI) and posterior intestine (Control-PI) of S. aurata fed the control diet, and anterior (BS0.06%-AI) and posterior intestine (BS0.06%-PI) of S. aurata fed a basal diet supplemented with a blend of bile salts at a dietary inclusion level of 0.06% (BS0.06%).
