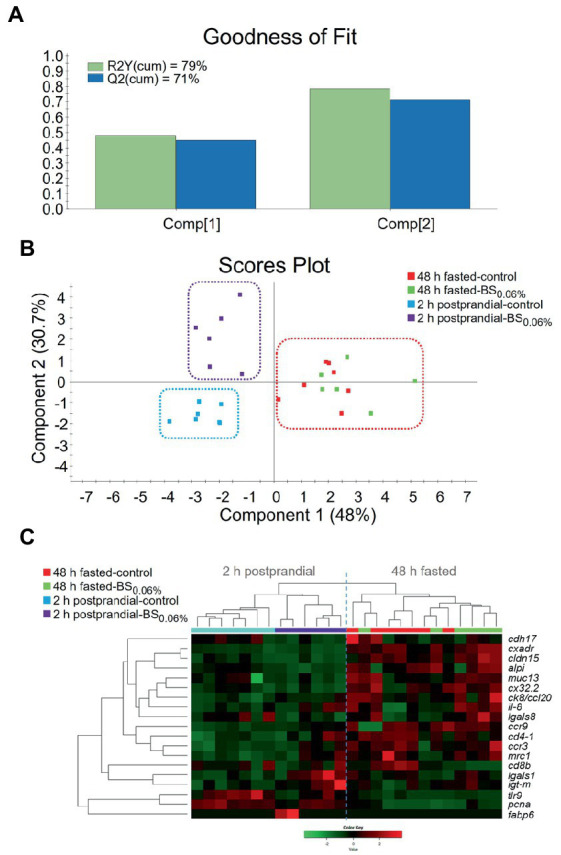
Figure 4.

(A) Graphical representation of the goodness of fit of the PLS-DA model. (B) Scores plot for two-dimensional PLS-DA representing sample distribution between the two components of the model on the basis of their intestinal expression profiles based on statistically significant genes (p < 0.1). (C) Heatmap plotting hierarchical clustering among statistically significant genes (p < 0.1) on the basis of their expression pattern (Color Key scale) allowing to discriminate for sample distribution. Samples were obtained from anterior intestine (AI) of 48 h fasted- and 2 h postprandial-gilthead seabream (Sparus aurata; n = 8 per dietary treatment) that were fed the control and the experimental diet supplemented with a blend of bile salts at a dietary inclusion level of 0.06% (BS0.06%).
