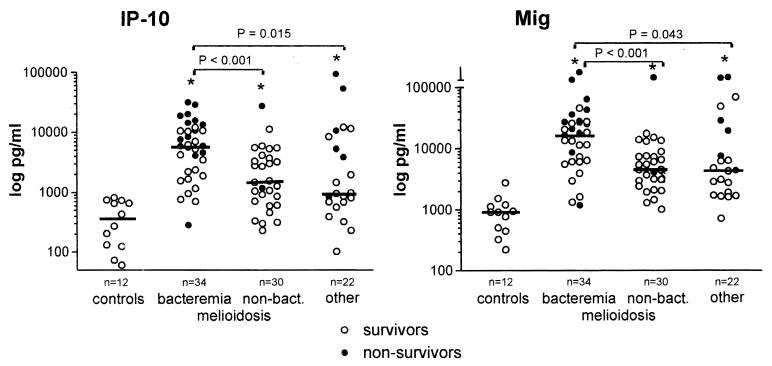
FIG. 1.
Plasma concentrations of IP-10 and Mig on admission in patients with culture-proven melioidosis (bacteremic and nonbacteremic), patients with diseases other than melioidosis, and healthy controls. Horizontal lines represent medians. ∗, P < 0.05 versus controls. P values reflect differences between groups by the Mann-Whitney U test.

